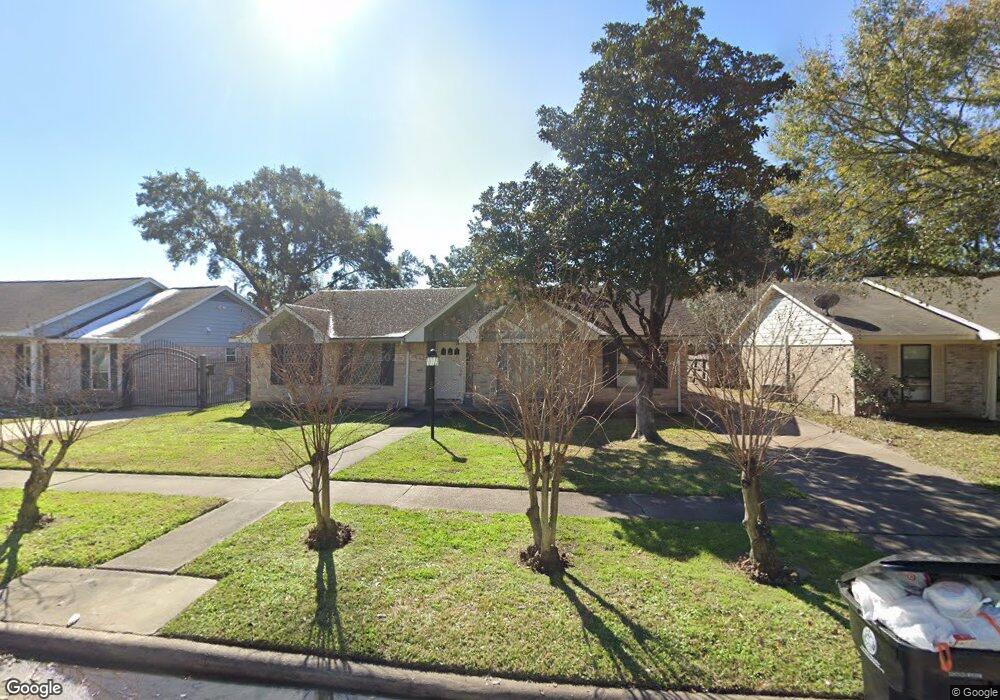
9219 Triola Ln Houston, TX 77036
Chinatown NeighborhoodEstimated Value: $291,000 - $318,000
3
Beds
2
Baths
1,888
Sq Ft
$161/Sq Ft
Est. Value
About This Home
This home is located at 9219 Triola Ln, Houston, TX 77036 and is currently estimated at $304,569, approximately $161 per square foot. 9219 Triola Ln is a home located in Harris County with nearby schools including Ed White Elementary School, Sugar Grove Academy, and Sharpstown High School.
Ownership History
Date
Name
Owned For
Owner Type
Purchase Details
Closed on
Aug 25, 2021
Sold by
Chi Chiu Chung and Chi Yi-Weng
Bought by
Liu Kevin Tie Cheng and Chen Minnie
Current Estimated Value
Home Financials for this Owner
Home Financials are based on the most recent Mortgage that was taken out on this home.
Original Mortgage
$187,500
Outstanding Balance
$170,239
Interest Rate
2.8%
Mortgage Type
New Conventional
Estimated Equity
$134,330
Purchase Details
Closed on
Aug 31, 1998
Sold by
Liu Chao Kung and Mak Siu Hung
Bought by
Chi Chiu Chang and Chi Yi Weng
Home Financials for this Owner
Home Financials are based on the most recent Mortgage that was taken out on this home.
Original Mortgage
$64,500
Interest Rate
6.94%
Purchase Details
Closed on
Jul 17, 1996
Sold by
Pimm Betty J
Bought by
Liu Chao Kung and Mak Siu Hung
Home Financials for this Owner
Home Financials are based on the most recent Mortgage that was taken out on this home.
Original Mortgage
$51,000
Interest Rate
8.33%
Create a Home Valuation Report for This Property
The Home Valuation Report is an in-depth analysis detailing your home's value as well as a comparison with similar homes in the area
Home Values in the Area
Average Home Value in this Area
Purchase History
| Date | Buyer | Sale Price | Title Company |
|---|---|---|---|
| Liu Kevin Tie Cheng | -- | Texas Star Title Llc | |
| Chi Chiu Chang | -- | Fidelity National Title | |
| Liu Chao Kung | -- | Stewart Title |
Source: Public Records
Mortgage History
| Date | Status | Borrower | Loan Amount |
|---|---|---|---|
| Open | Liu Kevin Tie Cheng | $187,500 | |
| Previous Owner | Chi Chiu Chang | $64,500 | |
| Previous Owner | Liu Chao Kung | $51,000 |
Source: Public Records
Tax History Compared to Growth
Tax History
| Year | Tax Paid | Tax Assessment Tax Assessment Total Assessment is a certain percentage of the fair market value that is determined by local assessors to be the total taxable value of land and additions on the property. | Land | Improvement |
|---|---|---|---|---|
| 2025 | $5,175 | $264,254 | $100,377 | $163,877 |
| 2024 | $5,175 | $247,316 | $100,377 | $146,939 |
| 2023 | $5,175 | $289,788 | $100,377 | $189,411 |
| 2022 | $5,644 | $247,351 | $58,553 | $188,798 |
| 2021 | $4,717 | $202,377 | $50,188 | $152,189 |
| 2020 | $4,795 | $191,679 | $50,188 | $141,491 |
| 2019 | $5,672 | $217,300 | $50,188 | $167,112 |
| 2018 | $4,808 | $190,000 | $50,188 | $139,812 |
| 2017 | $4,956 | $190,000 | $50,188 | $139,812 |
| 2016 | $4,779 | $183,197 | $50,188 | $133,009 |
| 2015 | $3,917 | $152,377 | $50,188 | $102,189 |
| 2014 | $3,917 | $152,377 | $50,188 | $102,189 |
Source: Public Records
Map
Nearby Homes
- 9215 Sharpcrest St
- 9238 Stroud Dr
- 9506 Hendon Ln
- 7939 Kendalia Dr
- 9234 Westwood Village Dr Unit 17
- 9006 Roos Rd
- 9345 Westwood Village Dr Unit 30
- 8923 Hendon Ln
- 9393 Westwood Village Dr Unit 64
- 8826 Rowan Ln
- 8818 Roos Rd
- 8902 Langdon Ln
- 7303 Augustine Dr
- 9901 Sharpcrest St Unit K3
- 9901 Sharpcrest St Unit M6
- 9901 Sharpcrest St Unit F3
- 9901 Sharpcrest St Unit B3
- 9901 Sharpcrest St Unit 8
- 9201 Clarewood Dr Unit 203
- 9201 Clarewood Dr Unit 10