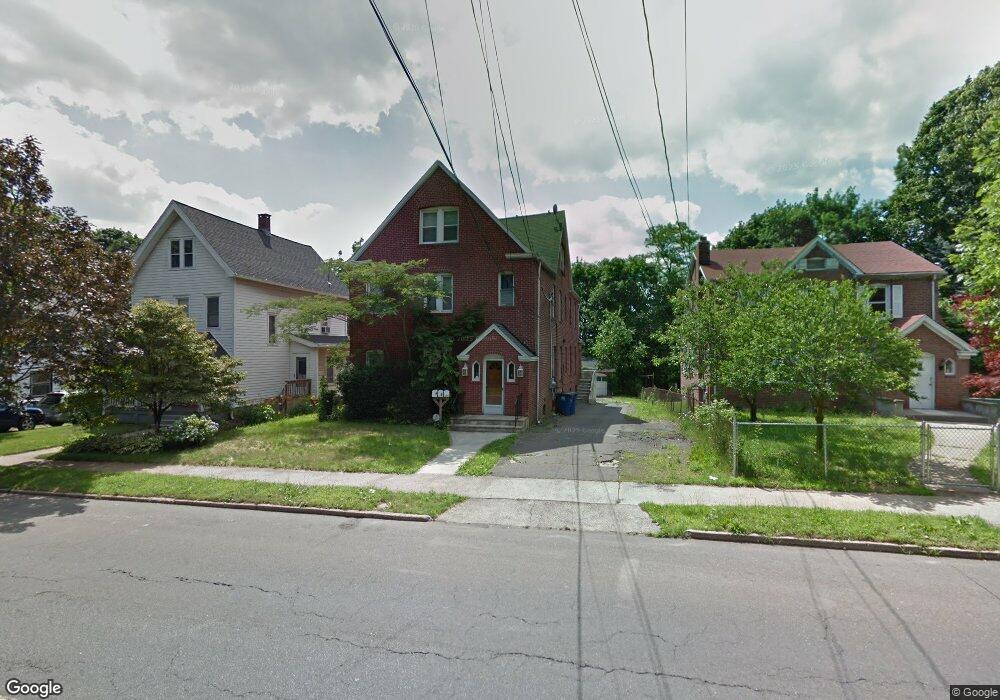
922 Townsend Ave New Haven, CT 06512
Annex NeighborhoodEstimated Value: $457,000 - $702,000
7
Beds
3
Baths
3,916
Sq Ft
$139/Sq Ft
Est. Value
About This Home
This home is located at 922 Townsend Ave, New Haven, CT 06512 and is currently estimated at $544,000, approximately $138 per square foot. 922 Townsend Ave is a home located in New Haven County with nearby schools including Cold Spring School, St Francis & St Rose Of Lima School, and Pathway School.
Ownership History
Date
Name
Owned For
Owner Type
Purchase Details
Closed on
Mar 17, 2010
Sold by
Goldfuss Tom and Goldfuss Heather
Bought by
Draouich Joseph and Kerrouch Samantha
Current Estimated Value
Home Financials for this Owner
Home Financials are based on the most recent Mortgage that was taken out on this home.
Original Mortgage
$125,000
Interest Rate
5.05%
Purchase Details
Closed on
Jul 5, 2005
Sold by
Decola Gayle A
Bought by
Goldeuss Tom and Kekacs Heather
Home Financials for this Owner
Home Financials are based on the most recent Mortgage that was taken out on this home.
Original Mortgage
$300,720
Interest Rate
5.73%
Purchase Details
Closed on
Jan 18, 2000
Sold by
Criscuolo Alphonse and Denardis Elizabeth
Bought by
Silvestri Gayle A
Home Financials for this Owner
Home Financials are based on the most recent Mortgage that was taken out on this home.
Original Mortgage
$154,400
Interest Rate
7.79%
Create a Home Valuation Report for This Property
The Home Valuation Report is an in-depth analysis detailing your home's value as well as a comparison with similar homes in the area
Home Values in the Area
Average Home Value in this Area
Purchase History
| Date | Buyer | Sale Price | Title Company |
|---|---|---|---|
| Draouich Joseph | $247,400 | -- | |
| Goldeuss Tom | $375,900 | -- | |
| Silvestri Gayle A | $156,500 | -- |
Source: Public Records
Mortgage History
| Date | Status | Borrower | Loan Amount |
|---|---|---|---|
| Closed | Silvestri Gayle A | $125,000 | |
| Previous Owner | Silvestri Gayle A | $300,720 | |
| Previous Owner | Silvestri Gayle A | $154,400 |
Source: Public Records
Tax History Compared to Growth
Tax History
| Year | Tax Paid | Tax Assessment Tax Assessment Total Assessment is a certain percentage of the fair market value that is determined by local assessors to be the total taxable value of land and additions on the property. | Land | Improvement |
|---|---|---|---|---|
| 2025 | $9,904 | $251,370 | $54,320 | $197,050 |
| 2024 | $9,678 | $251,370 | $54,320 | $197,050 |
| 2023 | $9,351 | $251,370 | $54,320 | $197,050 |
| 2022 | $9,992 | $251,370 | $54,320 | $197,050 |
| 2021 | $7,501 | $170,940 | $31,010 | $139,930 |
| 2020 | $7,501 | $170,940 | $31,010 | $139,930 |
| 2019 | $7,347 | $170,940 | $31,010 | $139,930 |
| 2018 | $7,347 | $170,940 | $31,010 | $139,930 |
| 2017 | $6,612 | $170,940 | $31,010 | $139,930 |
| 2016 | $5,919 | $142,450 | $31,010 | $111,440 |
| 2015 | $5,919 | $142,450 | $31,010 | $111,440 |
| 2014 | $5,919 | $142,450 | $31,010 | $111,440 |
Source: Public Records
Map
Nearby Homes
- 30 Upson Terrace
- 516 Woodward Ave
- 444 Woodward Ave
- 32 Huntington Ave
- 44 Huntington Ave
- 62 Huntington Rd Unit 7
- 45 Huntington Ave
- 1090 Townsend Ave
- 666 Woodward Ave Unit 666
- 66 Elizabeth Ann Dr
- 745 Townsend Ave Unit Lot 1
- 745 Townsend Ave Unit Lot 2
- 745 Townsend Ave Unit Lot 4
- 745 Townsend Ave Unit Lot 6
- 745 Townsend Ave Unit Lot 3
- 745 Townsend Ave Unit Lot 5
- 1117 Townsend Ave
- 112 Harrington Ave
- 120 Harrington Ave
- 18 Lenox St
- 928 Townsend Ave
- 928 Townsend Ave Unit 1
- 918 Townsend Ave
- 916 Townsend Ave
- 936 Townsend Ave
- 359 Kneeland Rd
- 353 Kneeland Rd
- 347 Kneeland Rd
- 944 Townsend Ave
- 908 Townsend Ave
- 932 Townsend Ave
- 341 Kneeland Rd
- 950 Townsend Ave
- 950 Townsend Ave
- 950 Townsend Ave Unit 1
- 950 Townsend Ave Unit B
- 950 Townsend Ave Unit A
- 950 Townsend Ave Unit 2nd
- 950 Townsend Ave Unit 2
- 902 Townsend Ave