Estimated Value: $533,000 - $625,000
4
Beds
3
Baths
3,003
Sq Ft
$189/Sq Ft
Est. Value
About This Home
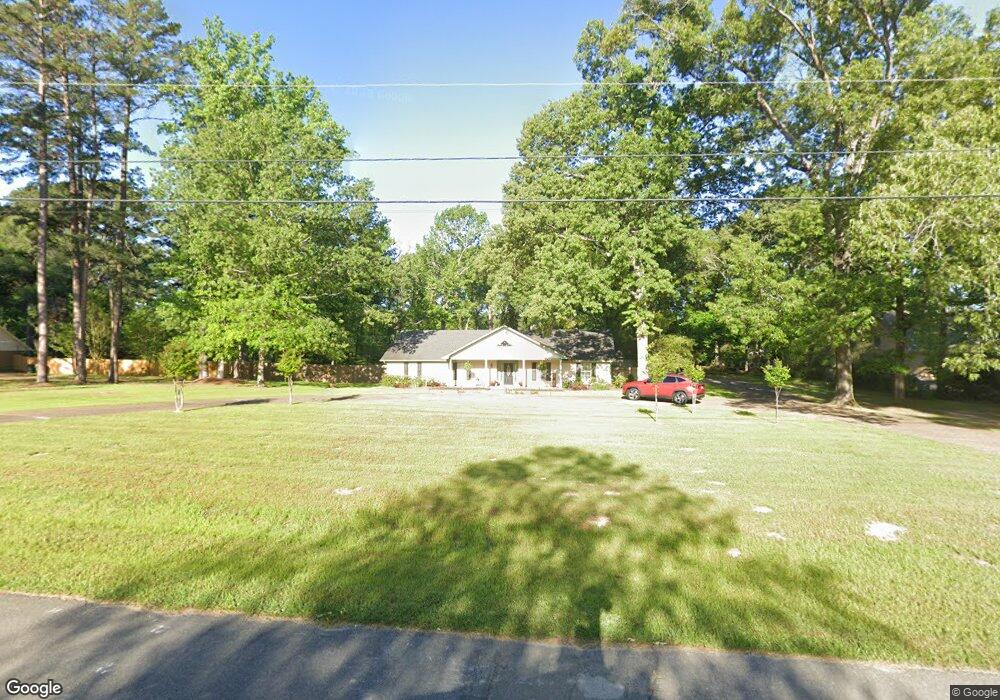
This home is located at 9223 Cherokee Trail, Tyler, TX 75703 and is currently estimated at $567,851, approximately $189 per square foot. 9223 Cherokee Trail is a home located in Smith County with nearby schools including Dr. Bryan C. Jack Elementary School, Hubbard Middle School, and Tyler Legacy High School.
Ownership History
Date
Name
Owned For
Owner Type
Purchase Details
Closed on
Jan 29, 2016
Sold by
Thurman Jeffrey N and Thurman Dana S
Bought by
Kirkham Charles D and Kirkham Deborah A
Current Estimated Value
Home Financials for this Owner
Home Financials are based on the most recent Mortgage that was taken out on this home.
Original Mortgage
$256,000
Outstanding Balance
$203,393
Interest Rate
4.01%
Mortgage Type
New Conventional
Estimated Equity
$364,458
Purchase Details
Closed on
Sep 28, 2012
Sold by
Griffin Jonathan Colt and Griffin Allyson
Bought by
Thurman Jeffrey N and Thurman Dana S
Home Financials for this Owner
Home Financials are based on the most recent Mortgage that was taken out on this home.
Original Mortgage
$122,000
Interest Rate
3.7%
Mortgage Type
New Conventional
Purchase Details
Closed on
Sep 25, 2009
Sold by
Mccauley Brent R and Mccauley Jan B
Bought by
Griffin Jonathan Colt and Griffin Allyson
Home Financials for this Owner
Home Financials are based on the most recent Mortgage that was taken out on this home.
Original Mortgage
$168,500
Interest Rate
5.36%
Mortgage Type
New Conventional
Create a Home Valuation Report for This Property
The Home Valuation Report is an in-depth analysis detailing your home's value as well as a comparison with similar homes in the area
Home Values in the Area
Average Home Value in this Area
Purchase History
| Date | Buyer | Sale Price | Title Company |
|---|---|---|---|
| Kirkham Charles D | -- | Ctc | |
| Thurman Jeffrey N | -- | None Available | |
| Griffin Jonathan Colt | -- | None Available |
Source: Public Records
Mortgage History
| Date | Status | Borrower | Loan Amount |
|---|---|---|---|
| Open | Kirkham Charles D | $256,000 | |
| Previous Owner | Thurman Jeffrey N | $122,000 | |
| Previous Owner | Griffin Jonathan Colt | $168,500 |
Source: Public Records
Tax History Compared to Growth
Tax History
| Year | Tax Paid | Tax Assessment Tax Assessment Total Assessment is a certain percentage of the fair market value that is determined by local assessors to be the total taxable value of land and additions on the property. | Land | Improvement |
|---|---|---|---|---|
| 2025 | $5,472 | $557,134 | $173,503 | $383,631 |
| 2024 | $5,472 | $482,107 | $80,220 | $401,887 |
| 2023 | $7,947 | $481,678 | $80,220 | $401,458 |
| 2022 | $8,120 | $414,463 | $60,165 | $354,298 |
| 2021 | $7,961 | $379,434 | $60,165 | $319,269 |
| 2020 | $7,613 | $355,764 | $57,357 | $298,407 |
| 2019 | $7,612 | $348,120 | $57,357 | $290,763 |
| 2018 | $7,018 | $322,662 | $40,110 | $282,552 |
| 2017 | $6,889 | $322,662 | $40,110 | $282,552 |
| 2016 | $6,842 | $320,478 | $40,110 | $280,368 |
| 2015 | $5,266 | $253,660 | $37,149 | $216,511 |
| 2014 | $5,266 | $247,797 | $37,149 | $210,648 |
Source: Public Records
Map
Nearby Homes
- 1242 Rainmaker
- 1261 Luann Ln
- 1266 Santa fe Trail
- 1242 Colt Ln
- 8811 Wilder Trail
- 8831 Wilder Trail
- 8714 Wilder Trail
- 8702 Wilder Trail
- 8741 Wilder Trail
- 9211 Elm Tree Cir
- 1211 Centennial Trail
- 8810 Wilder Trail
- 628 Wilder Way
- 1625 Skidmore Ln
- 629 Winding Brook Ln
- 419 Wilder Way
- 1633 Legacy Ct
- 533 Skipping Stone Ln
- 533 Stepping Stone Ln
- 9214 Stonebank Crossing
- 9223 9223 Cherokee Trail
- 9205 9205 Cherokee Trail
- 9205 Cherokee Trail
- 9231 Cherokee Trail
- 9231 9231 Cherokee Trail
- 9226 Cherokee Trail
- 9311 Cherokee Trail
- 9132 Cherokee Trail
- 9132 9132 Cherokee Trail
- 9234 Cherokee Trail
- Lot 7 Cherokee Trail
- 9314 Cherokee Trail
- 9401 Cherokee Trail
- 9340 Cherokee Trail
- 9301 Chisholm Trail
- 9116 9116 Cherokee Trail
- 9116 Cherokee Trail
- 9116 Cherokee Trail
- 9319 Chisholm Trail
- 9319 9319 Chisholm Trail