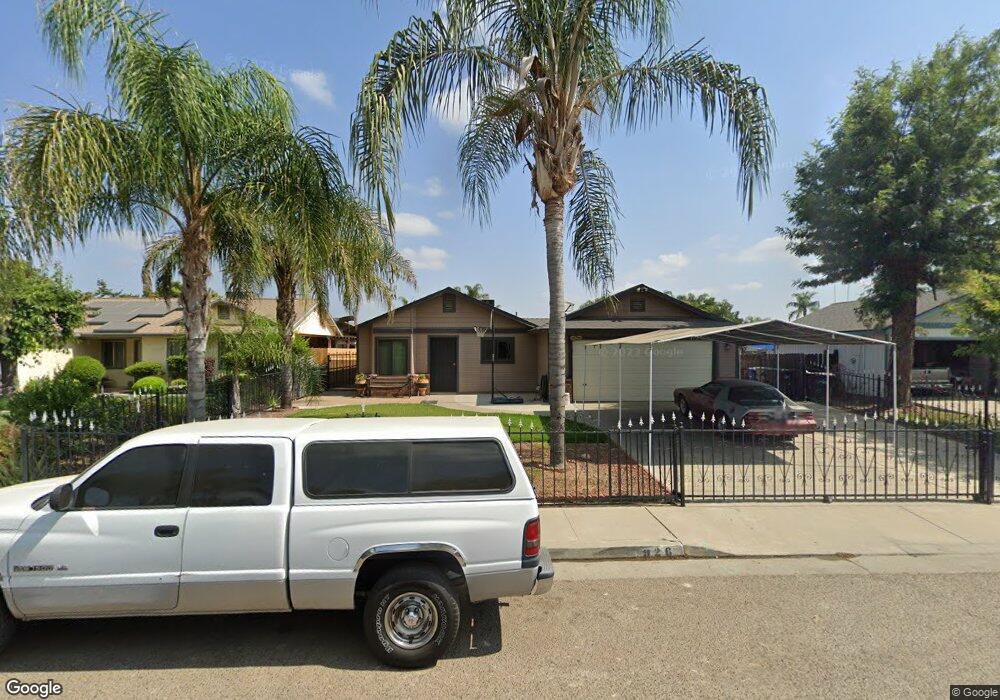
926 Dixie Ct Farmersville, CA 93223
Estimated Value: $278,000 - $291,569
3
Beds
2
Baths
1,185
Sq Ft
$243/Sq Ft
Est. Value
About This Home
This home is located at 926 Dixie Ct, Farmersville, CA 93223 and is currently estimated at $287,392, approximately $242 per square foot. 926 Dixie Ct is a home located in Tulare County with nearby schools including George L. Snowden Elementary School, J.E. Hester Elementary School, and Freedom Elementary School.
Ownership History
Date
Name
Owned For
Owner Type
Purchase Details
Closed on
Jul 16, 2015
Sold by
Rosas Miguel Angel
Bought by
Rosas Miguel Angel and Rosas Arredondo Marisela
Current Estimated Value
Home Financials for this Owner
Home Financials are based on the most recent Mortgage that was taken out on this home.
Original Mortgage
$79,150
Interest Rate
3.98%
Mortgage Type
New Conventional
Purchase Details
Closed on
Jan 17, 2003
Sold by
Garcia Alvaro
Bought by
Rosas Miguel A
Home Financials for this Owner
Home Financials are based on the most recent Mortgage that was taken out on this home.
Original Mortgage
$93,532
Interest Rate
5.93%
Mortgage Type
FHA
Purchase Details
Closed on
Apr 22, 1996
Sold by
Dixlee Management Inc
Bought by
Garcia Alvaro and Garcia Nicomedes
Home Financials for this Owner
Home Financials are based on the most recent Mortgage that was taken out on this home.
Original Mortgage
$85,250
Interest Rate
7.97%
Create a Home Valuation Report for This Property
The Home Valuation Report is an in-depth analysis detailing your home's value as well as a comparison with similar homes in the area
Home Values in the Area
Average Home Value in this Area
Purchase History
| Date | Buyer | Sale Price | Title Company |
|---|---|---|---|
| Rosas Miguel Angel | -- | First American Title Ins Co | |
| Rosas Miguel A | $95,000 | Chicago Title Co | |
| Garcia Alvaro | $84,500 | First American Title Ins Co |
Source: Public Records
Mortgage History
| Date | Status | Borrower | Loan Amount |
|---|---|---|---|
| Closed | Rosas Miguel Angel | $79,150 | |
| Closed | Rosas Miguel A | $93,532 | |
| Previous Owner | Garcia Alvaro | $85,250 | |
| Closed | Rosas Miguel A | $2,850 |
Source: Public Records
Tax History Compared to Growth
Tax History
| Year | Tax Paid | Tax Assessment Tax Assessment Total Assessment is a certain percentage of the fair market value that is determined by local assessors to be the total taxable value of land and additions on the property. | Land | Improvement |
|---|---|---|---|---|
| 2025 | $3,422 | $137,589 | $36,207 | $101,382 |
| 2024 | $3,422 | $134,893 | $35,498 | $99,395 |
| 2023 | $3,426 | $132,249 | $34,802 | $97,447 |
| 2022 | $3,315 | $129,657 | $34,120 | $95,537 |
| 2021 | $3,287 | $127,115 | $33,451 | $93,664 |
| 2020 | $3,231 | $125,812 | $33,108 | $92,704 |
| 2019 | $3,245 | $123,345 | $32,459 | $90,886 |
| 2018 | $3,202 | $120,927 | $31,823 | $89,104 |
| 2017 | $1,391 | $118,556 | $31,199 | $87,357 |
| 2016 | $1,317 | $116,231 | $30,587 | $85,644 |
| 2015 | $1,160 | $114,486 | $30,128 | $84,358 |
| 2014 | $1,160 | $103,000 | $26,000 | $77,000 |
Source: Public Records
Map
Nearby Homes
- 245 W Oakland St
- 327 S Farmersville Blvd
- 209 S Magnolia Ave
- 528 S Camelia Ave
- 896 N Mariposa Ave
- 438 N Magnolia Ave
- 701 Farmersville Rd
- 896 Farmersville Rd
- 680 E Larry St
- 738 E Larry St
- 885 E Ash St
- 188 E Citrus Dr
- 903 E Ash St
- 322 E Citrus Dr
- 732 N Dwight Ave
- 1643 Tehama Ave
- 0 Apn 128-030-056-000 Unit 218742
- 0 Avenue 288
- 753 N Brundage Ave
- 0 Avenue 288