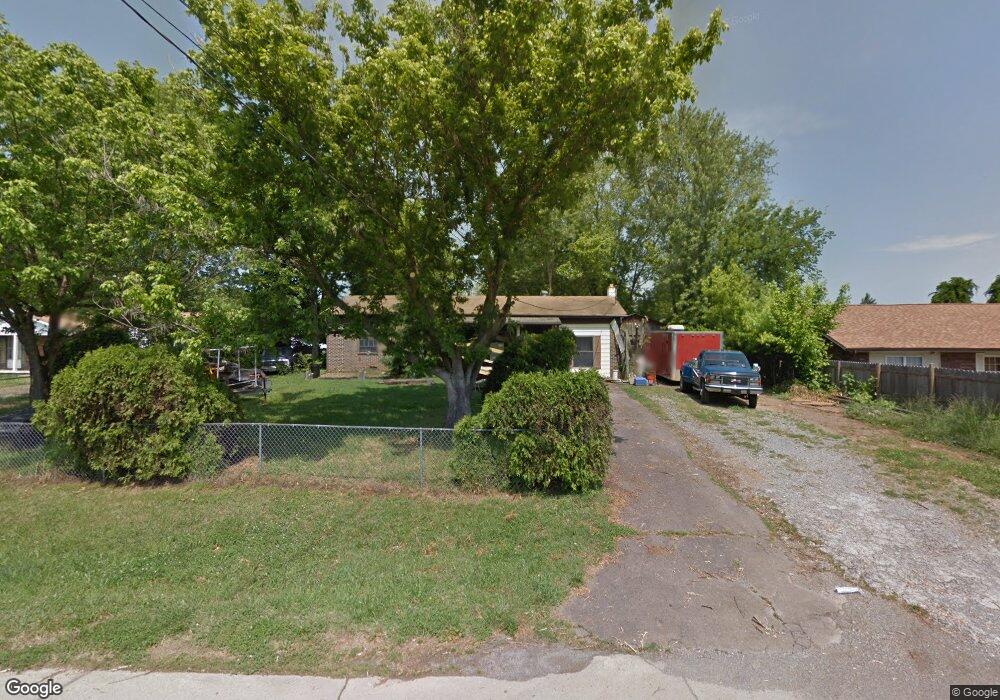
926 Houston Dr Seymour, TN 37865
Estimated Value: $240,236 - $303,000
--
Bed
2
Baths
1,187
Sq Ft
$236/Sq Ft
Est. Value
About This Home
This home is located at 926 Houston Dr, Seymour, TN 37865 and is currently estimated at $280,059, approximately $235 per square foot. 926 Houston Dr is a home located in Blount County with nearby schools including Prospect Elementary School, Heritage Middle School, and Heritage High School.
Ownership History
Date
Name
Owned For
Owner Type
Purchase Details
Closed on
May 1, 2016
Sold by
Webb Lester W
Bought by
Webb Lester W and Webb Denise C
Current Estimated Value
Purchase Details
Closed on
Oct 1, 2014
Sold by
Webb Lester W and Webb Brenda J
Bought by
Webb Lester W and Webb Denise C
Purchase Details
Closed on
Aug 1, 1979
Bought by
Webb Lester W and Webb Brenda J
Create a Home Valuation Report for This Property
The Home Valuation Report is an in-depth analysis detailing your home's value as well as a comparison with similar homes in the area
Home Values in the Area
Average Home Value in this Area
Purchase History
| Date | Buyer | Sale Price | Title Company |
|---|---|---|---|
| Webb Lester W | -- | -- | |
| Webb Lester W | -- | -- | |
| Webb Lester W | -- | -- |
Source: Public Records
Tax History Compared to Growth
Tax History
| Year | Tax Paid | Tax Assessment Tax Assessment Total Assessment is a certain percentage of the fair market value that is determined by local assessors to be the total taxable value of land and additions on the property. | Land | Improvement |
|---|---|---|---|---|
| 2025 | $672 | $42,250 | $0 | $0 |
| 2024 | $672 | $42,250 | $10,000 | $32,250 |
| 2023 | $672 | $42,250 | $10,000 | $32,250 |
| 2022 | $577 | $23,375 | $6,250 | $17,125 |
| 2021 | $577 | $23,375 | $6,250 | $17,125 |
| 2020 | $577 | $23,375 | $6,250 | $17,125 |
| 2019 | $577 | $23,375 | $6,250 | $17,125 |
| 2018 | $497 | $20,125 | $5,000 | $15,125 |
| 2017 | $497 | $20,125 | $5,000 | $15,125 |
| 2016 | $497 | $20,125 | $5,000 | $15,125 |
| 2015 | $433 | $20,125 | $5,000 | $15,125 |
| 2014 | $448 | $20,125 | $5,000 | $15,125 |
| 2013 | $448 | $20,825 | $0 | $0 |
Source: Public Records
Map
Nearby Homes
- 5925 Sevierville Rd
- 830 Easey St
- 0 Miller Cir
- 715 Winston Dr
- 634 Crestview Ct
- 827 Hinkle Estates Dr
- 237 Westmoreland Ct
- 205 Blue Ridge Ln
- 862 Hinkle Estates Dr
- 521 Devon St
- 116 Blue Ridge Ln
- 516 Keck St
- 1137 Oakes Vista Ln
- 534 Tennessee Cir
- 516 Cherokee Hills Rd
- 1506 Cunningham Rd W
- 0 Burns Ln
- 6116 Nails Creek Rd
- 1419 Cheyenne Blvd
- 802 Hinkle Rd