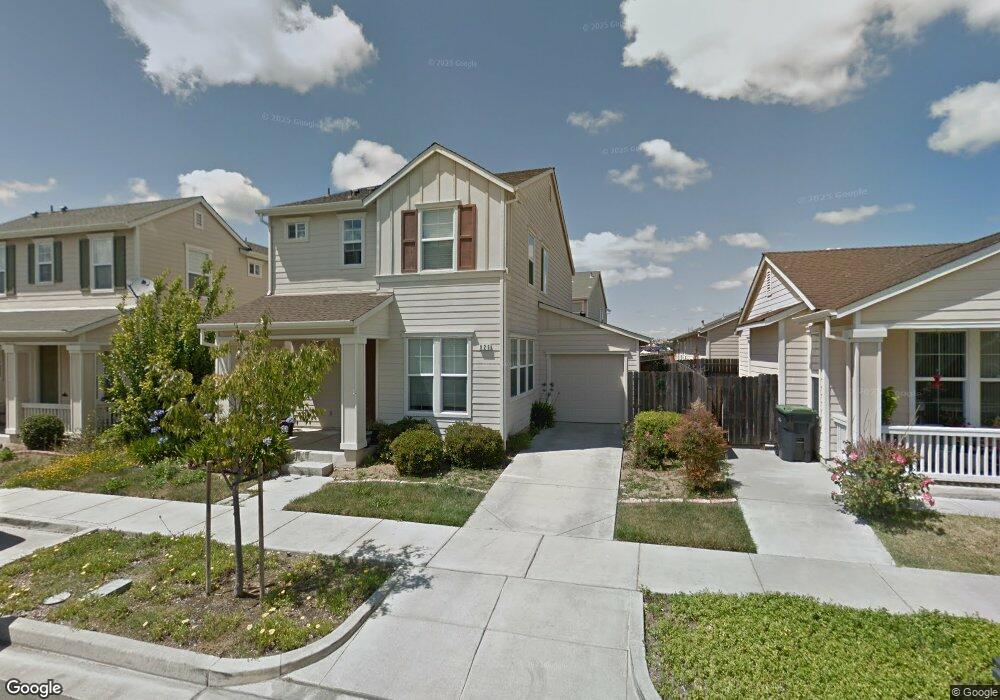
926 Liberty Dr Suisun City, CA 94585
Estimated Value: $539,000 - $574,031
3
Beds
3
Baths
1,760
Sq Ft
$316/Sq Ft
Est. Value
About This Home
This home is located at 926 Liberty Dr, Suisun City, CA 94585 and is currently estimated at $556,508, approximately $316 per square foot. 926 Liberty Dr is a home located in Solano County with nearby schools including Crescent Elementary School, Crystal Middle School, and Armijo High School.
Ownership History
Date
Name
Owned For
Owner Type
Purchase Details
Closed on
Aug 9, 2016
Sold by
Crosby Melissa L and Crosby Benjamin A
Bought by
Singh Harvinder and Bindra Baljeet K
Current Estimated Value
Home Financials for this Owner
Home Financials are based on the most recent Mortgage that was taken out on this home.
Original Mortgage
$289,656
Outstanding Balance
$237,725
Interest Rate
4.4%
Mortgage Type
FHA
Estimated Equity
$318,783
Purchase Details
Closed on
Jul 18, 2005
Sold by
New America Homes/Md89 Inc
Bought by
Lavelle Melissa L and Crosby Benjamin A
Home Financials for this Owner
Home Financials are based on the most recent Mortgage that was taken out on this home.
Original Mortgage
$89,200
Interest Rate
5.51%
Mortgage Type
Credit Line Revolving
Purchase Details
Closed on
Jun 3, 2004
Sold by
Miller Sorg Group Inc
Bought by
New America Homes/Md89 Inc
Create a Home Valuation Report for This Property
The Home Valuation Report is an in-depth analysis detailing your home's value as well as a comparison with similar homes in the area
Home Values in the Area
Average Home Value in this Area
Purchase History
| Date | Buyer | Sale Price | Title Company |
|---|---|---|---|
| Singh Harvinder | $295,000 | Placer Title Company | |
| Lavelle Melissa L | $446,500 | First American Title Co | |
| New America Homes/Md89 Inc | -- | First American Title Co |
Source: Public Records
Mortgage History
| Date | Status | Borrower | Loan Amount |
|---|---|---|---|
| Open | Singh Harvinder | $289,656 | |
| Previous Owner | Lavelle Melissa L | $89,200 | |
| Previous Owner | Lavelle Melissa L | $356,800 |
Source: Public Records
Tax History Compared to Growth
Tax History
| Year | Tax Paid | Tax Assessment Tax Assessment Total Assessment is a certain percentage of the fair market value that is determined by local assessors to be the total taxable value of land and additions on the property. | Land | Improvement |
|---|---|---|---|---|
| 2025 | $5,144 | $342,367 | $98,646 | $243,721 |
| 2024 | $5,144 | $335,655 | $96,712 | $238,943 |
| 2023 | $5,012 | $329,074 | $94,816 | $234,258 |
| 2022 | $4,950 | $322,622 | $92,958 | $229,664 |
| 2021 | $4,749 | $316,297 | $91,136 | $225,161 |
| 2020 | $4,635 | $313,055 | $90,202 | $222,853 |
| 2019 | $4,505 | $306,918 | $88,434 | $218,484 |
| 2018 | $4,627 | $300,900 | $86,700 | $214,200 |
| 2017 | $4,437 | $295,000 | $85,000 | $210,000 |
| 2016 | $4,962 | $337,000 | $90,000 | $247,000 |
| 2015 | $4,431 | $311,000 | $84,000 | $227,000 |
| 2014 | $3,901 | $262,000 | $73,000 | $189,000 |
Source: Public Records
Map
Nearby Homes