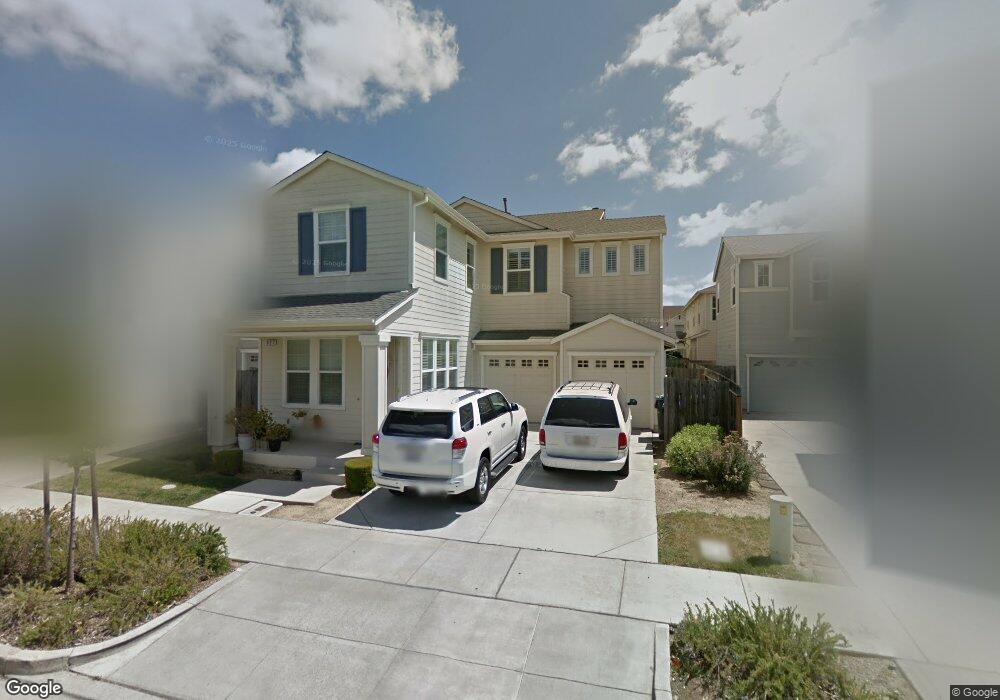
927 Liberty Dr Suisun City, CA 94585
Estimated Value: $582,000 - $619,000
4
Beds
3
Baths
2,202
Sq Ft
$270/Sq Ft
Est. Value
About This Home
This home is located at 927 Liberty Dr, Suisun City, CA 94585 and is currently estimated at $594,570, approximately $270 per square foot. 927 Liberty Dr is a home located in Solano County with nearby schools including Crescent Elementary School, Crystal Middle School, and Armijo High School.
Ownership History
Date
Name
Owned For
Owner Type
Purchase Details
Closed on
Apr 20, 2021
Sold by
Reyes Alyssa A
Bought by
Baybayan Joeben J
Current Estimated Value
Home Financials for this Owner
Home Financials are based on the most recent Mortgage that was taken out on this home.
Original Mortgage
$294,000
Outstanding Balance
$265,659
Interest Rate
3.05%
Mortgage Type
New Conventional
Estimated Equity
$328,911
Purchase Details
Closed on
Oct 22, 2013
Sold by
Baybayan Joeben J and Baybayan Joeben
Bought by
Baybayan Joeben J
Home Financials for this Owner
Home Financials are based on the most recent Mortgage that was taken out on this home.
Original Mortgage
$246,000
Interest Rate
4.53%
Mortgage Type
New Conventional
Purchase Details
Closed on
Mar 7, 2011
Sold by
New York Life Insurance Company
Bought by
Baybayan Joeben
Home Financials for this Owner
Home Financials are based on the most recent Mortgage that was taken out on this home.
Original Mortgage
$216,372
Interest Rate
4.87%
Mortgage Type
FHA
Purchase Details
Closed on
Aug 25, 2010
Sold by
Ngo Lawrence Yu
Bought by
New York Life Insurance Company
Purchase Details
Closed on
Jan 2, 2007
Sold by
Ngo Lawrence Yu
Bought by
Ngo Lawrence Yu and Ngo Eleanor N
Home Financials for this Owner
Home Financials are based on the most recent Mortgage that was taken out on this home.
Original Mortgage
$447,000
Interest Rate
6.5%
Mortgage Type
Purchase Money Mortgage
Purchase Details
Closed on
Nov 20, 2006
Sold by
Ngo Eleanor N
Bought by
Ngo Lawrence Yu
Home Financials for this Owner
Home Financials are based on the most recent Mortgage that was taken out on this home.
Original Mortgage
$447,000
Interest Rate
6.5%
Mortgage Type
Purchase Money Mortgage
Purchase Details
Closed on
Aug 31, 2005
Sold by
New America Homes/Md89 Inc
Bought by
Ngo Lawrence Yu
Home Financials for this Owner
Home Financials are based on the most recent Mortgage that was taken out on this home.
Original Mortgage
$54,840
Interest Rate
5.64%
Mortgage Type
Credit Line Revolving
Purchase Details
Closed on
Aug 25, 2005
Sold by
Ngo Eleanor N
Bought by
Ngo Lawrence Yu
Home Financials for this Owner
Home Financials are based on the most recent Mortgage that was taken out on this home.
Original Mortgage
$54,840
Interest Rate
5.64%
Mortgage Type
Credit Line Revolving
Create a Home Valuation Report for This Property
The Home Valuation Report is an in-depth analysis detailing your home's value as well as a comparison with similar homes in the area
Home Values in the Area
Average Home Value in this Area
Purchase History
| Date | Buyer | Sale Price | Title Company |
|---|---|---|---|
| Baybayan Joeben J | -- | Old Republic Title Company | |
| Baybayan Joeben J | -- | Old Republic Title Company | |
| Baybayan Joeben J | -- | Old Republic Title Company | |
| Baybayan Joeben | $222,000 | None Available | |
| New York Life Insurance Company | $504,605 | First American Title Ins Co | |
| Ngo Lawrence Yu | -- | None Available | |
| Ngo Lawrence Yu | -- | First American Title Ins Co | |
| Ngo Lawrence Yu | $548,500 | First American Title Co | |
| Ngo Lawrence Yu | -- | First American Title Co |
Source: Public Records
Mortgage History
| Date | Status | Borrower | Loan Amount |
|---|---|---|---|
| Open | Baybayan Joeben J | $294,000 | |
| Closed | Baybayan Joeben J | $246,000 | |
| Closed | Baybayan Joeben | $216,372 | |
| Previous Owner | Ngo Lawrence Yu | $447,000 | |
| Previous Owner | Ngo Lawrence Yu | $54,840 | |
| Previous Owner | Ngo Lawrence Yu | $438,750 |
Source: Public Records
Tax History Compared to Growth
Tax History
| Year | Tax Paid | Tax Assessment Tax Assessment Total Assessment is a certain percentage of the fair market value that is determined by local assessors to be the total taxable value of land and additions on the property. | Land | Improvement |
|---|---|---|---|---|
| 2025 | $4,501 | $284,410 | $83,270 | $201,140 |
| 2024 | $4,501 | $278,835 | $81,638 | $197,197 |
| 2023 | $4,388 | $273,369 | $80,038 | $193,331 |
| 2022 | $4,334 | $268,010 | $78,469 | $189,541 |
| 2021 | $4,139 | $262,756 | $76,931 | $185,825 |
| 2020 | $4,040 | $260,063 | $76,143 | $183,920 |
| 2019 | $3,924 | $254,964 | $74,650 | $180,314 |
| 2018 | $4,021 | $249,966 | $73,187 | $176,779 |
| 2017 | $3,859 | $245,065 | $71,752 | $173,313 |
| 2016 | $3,824 | $240,261 | $70,346 | $169,915 |
| 2015 | $3,602 | $236,653 | $69,290 | $167,363 |
| 2014 | $3,562 | $232,018 | $67,933 | $164,085 |
Source: Public Records
Map
Nearby Homes