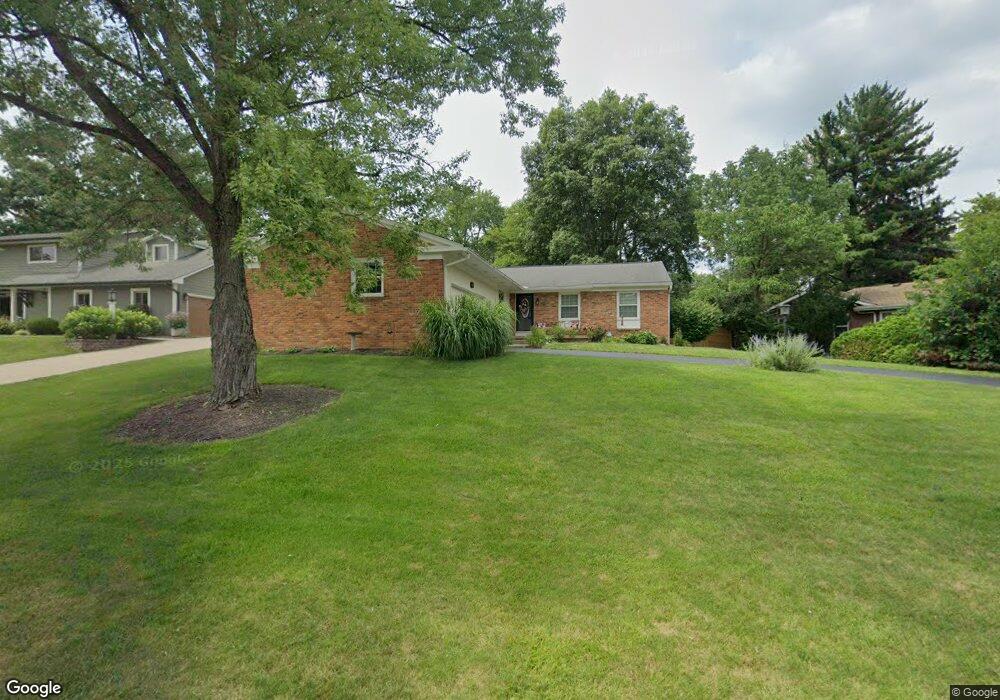
930 Stoney Creek Rd Columbus, OH 43235
Indian Hills NeighborhoodEstimated Value: $410,310 - $512,000
3
Beds
2
Baths
1,652
Sq Ft
$278/Sq Ft
Est. Value
About This Home
This home is located at 930 Stoney Creek Rd, Columbus, OH 43235 and is currently estimated at $459,828, approximately $278 per square foot. 930 Stoney Creek Rd is a home located in Franklin County with nearby schools including Gables Elementary School, Ridgeview Middle School, and Centennial High School.
Ownership History
Date
Name
Owned For
Owner Type
Purchase Details
Closed on
Oct 18, 2011
Sold by
Cr Home Rental Cribz Llc
Bought by
Tibbals Gail W
Current Estimated Value
Home Financials for this Owner
Home Financials are based on the most recent Mortgage that was taken out on this home.
Original Mortgage
$180,500
Outstanding Balance
$123,227
Interest Rate
4.12%
Mortgage Type
New Conventional
Estimated Equity
$336,601
Purchase Details
Closed on
Jul 1, 2011
Sold by
Passive Goals Llc
Bought by
Cr Home Rental Cribz Llc
Purchase Details
Closed on
Jun 22, 2011
Sold by
Secretary Of Housing & Urban Development
Bought by
Equity Central Llc
Purchase Details
Closed on
Mar 26, 2010
Sold by
Keister David L and Estate Of Irene E Flynn
Bought by
Secretary Of Housing & Urban Development
Purchase Details
Closed on
Nov 21, 2001
Sold by
Estate Of Daniel C Flynn
Bought by
Flynn Irene E
Purchase Details
Closed on
Nov 28, 1977
Bought by
Flynn Daniel C
Create a Home Valuation Report for This Property
The Home Valuation Report is an in-depth analysis detailing your home's value as well as a comparison with similar homes in the area
Home Values in the Area
Average Home Value in this Area
Purchase History
| Date | Buyer | Sale Price | Title Company |
|---|---|---|---|
| Tibbals Gail W | $190,000 | Stewart Title | |
| Cr Home Rental Cribz Llc | $110,000 | Hostetler | |
| Passive Goals Llc | $125,000 | Lakeside Ti | |
| Equity Central Llc | $85,001 | Lakeside Ti | |
| Secretary Of Housing & Urban Development | -- | Nova Title Agency Inc | |
| Flynn Irene E | -- | -- | |
| Flynn Daniel C | -- | -- |
Source: Public Records
Mortgage History
| Date | Status | Borrower | Loan Amount |
|---|---|---|---|
| Open | Tibbals Gail W | $180,500 |
Source: Public Records
Tax History Compared to Growth
Tax History
| Year | Tax Paid | Tax Assessment Tax Assessment Total Assessment is a certain percentage of the fair market value that is determined by local assessors to be the total taxable value of land and additions on the property. | Land | Improvement |
|---|---|---|---|---|
| 2024 | $4,818 | $117,150 | $53,900 | $63,250 |
| 2023 | $4,784 | $117,145 | $53,900 | $63,245 |
| 2022 | $4,489 | $95,310 | $33,460 | $61,850 |
| 2021 | $4,497 | $95,310 | $33,460 | $61,850 |
| 2020 | $4,503 | $95,310 | $33,460 | $61,850 |
| 2019 | $4,045 | $75,430 | $26,740 | $48,690 |
| 2018 | $3,802 | $75,430 | $26,740 | $48,690 |
| 2017 | $4,043 | $75,430 | $26,740 | $48,690 |
| 2016 | $3,930 | $68,080 | $21,810 | $46,270 |
| 2015 | $3,568 | $68,080 | $21,810 | $46,270 |
| 2014 | $3,576 | $68,080 | $21,810 | $46,270 |
| 2013 | $1,667 | $64,820 | $20,755 | $44,065 |
Source: Public Records
Map
Nearby Homes
- 5881 Rocky Rill Rd
- 838 Cambridge Ct
- 6041 Rocky Rill Rd
- 5854 Aqua Bay Dr Unit 5854
- 5936 Aqua Bay Dr
- 5938 Aqua Bay Dr
- 895 Linworth Village Dr
- 928 Linworth Village Dr
- 5773 Middlefield Dr
- 511 W Kanawha Ave
- 6105 Flora Villa Dr
- 1246 Southport Dr
- 1505 Eastmeadow Place
- 6577 Plesenton Dr S
- 301 W Riverglen Dr
- 1213 Nantucket Ave
- 409 Fenway Rd
- 290 W Kanawha Ave
- 252 W Kanawha Ave
- 5363 Godown Rd
- 930 Stoney Creek Rd Unit Indian Hills
- 920 Stoney Creek Rd
- 940 Stoney Creek Rd
- 916 Stoney Creek Rd
- 919 Stoney Creek Rd
- 950 Stoney Creek Rd
- 945 Greenridge Rd
- 915 Stoney Creek Rd
- 955 Greenridge Rd
- 933 Greenridge Rd
- 945 Stoney Creek Rd
- 911 Stoney Creek Rd
- 929 Stoney Creek Rd
- 960 Stoney Creek Rd
- 907 Stoney Creek Rd
- 969 Greenridge Rd
- 905 Stoney Creek Rd
- 915 Greenridge Rd
- 970 Stoney Creek Rd
- 979 Greenridge Rd