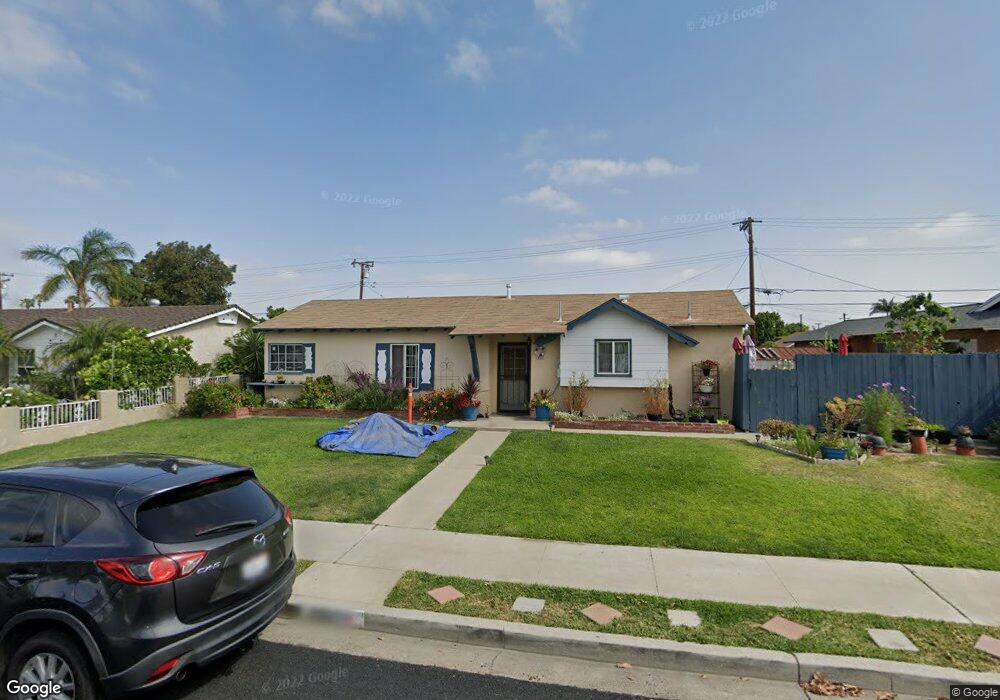
9301 Harle Ave Anaheim, CA 92804
West Anaheim NeighborhoodEstimated Value: $813,000 - $925,000
4
Beds
2
Baths
1,229
Sq Ft
$706/Sq Ft
Est. Value
About This Home
This home is located at 9301 Harle Ave, Anaheim, CA 92804 and is currently estimated at $867,994, approximately $706 per square foot. 9301 Harle Ave is a home located in Orange County with nearby schools including Jonas E. Salk Elementary School, Dale Jr High School, and Magnolia High.
Ownership History
Date
Name
Owned For
Owner Type
Purchase Details
Closed on
Mar 20, 2010
Sold by
Martinez Olivia
Bought by
Martinez Olivia and The Olivia Martinez Living Trust
Current Estimated Value
Purchase Details
Closed on
Nov 3, 2009
Sold by
Martinez Raymond and Martinez Olivia
Bought by
Martinez Olivia
Purchase Details
Closed on
Feb 14, 2000
Sold by
Federal National Mortgage Association
Bought by
Martinez Raymond and Martinez Olivia
Home Financials for this Owner
Home Financials are based on the most recent Mortgage that was taken out on this home.
Original Mortgage
$157,500
Outstanding Balance
$52,065
Interest Rate
8.16%
Estimated Equity
$815,929
Purchase Details
Closed on
Nov 22, 1999
Sold by
Nationsbanc Mtg Corp
Bought by
Federal National Mortgage Association
Purchase Details
Closed on
Nov 18, 1999
Sold by
Wolff Ronald J and Wolff Sami E
Bought by
Federal National Mortgage Association
Create a Home Valuation Report for This Property
The Home Valuation Report is an in-depth analysis detailing your home's value as well as a comparison with similar homes in the area
Home Values in the Area
Average Home Value in this Area
Purchase History
| Date | Buyer | Sale Price | Title Company |
|---|---|---|---|
| Martinez Olivia | -- | None Available | |
| Martinez Olivia | -- | None Available | |
| Martinez Raymond | $175,000 | Commonwealth Land Title | |
| Federal National Mortgage Association | -- | First American Title Ins Co | |
| Federal National Mortgage Association | $160,136 | First American Title Ins Co |
Source: Public Records
Mortgage History
| Date | Status | Borrower | Loan Amount |
|---|---|---|---|
| Open | Martinez Raymond | $157,500 |
Source: Public Records
Tax History Compared to Growth
Tax History
| Year | Tax Paid | Tax Assessment Tax Assessment Total Assessment is a certain percentage of the fair market value that is determined by local assessors to be the total taxable value of land and additions on the property. | Land | Improvement |
|---|---|---|---|---|
| 2025 | $3,246 | $261,276 | $179,675 | $81,601 |
| 2024 | $3,246 | $256,153 | $176,152 | $80,001 |
| 2023 | $3,163 | $251,131 | $172,698 | $78,433 |
| 2022 | $3,129 | $246,207 | $169,311 | $76,896 |
| 2021 | $3,048 | $241,380 | $165,991 | $75,389 |
| 2020 | $3,075 | $238,905 | $164,289 | $74,616 |
| 2019 | $3,006 | $234,221 | $161,068 | $73,153 |
| 2018 | $2,970 | $229,629 | $157,910 | $71,719 |
| 2017 | $2,873 | $225,127 | $154,814 | $70,313 |
| 2016 | $2,857 | $220,713 | $151,778 | $68,935 |
| 2015 | $2,824 | $217,398 | $149,498 | $67,900 |
| 2014 | $2,696 | $213,140 | $146,570 | $66,570 |
Source: Public Records
Map
Nearby Homes
- 9272 Cerritos Ave
- 9155 Pacific Ave Unit 265
- 2533 W Chanticleer Rd
- 90093 Stacie Ln
- 10301 Rhiems Rd
- 2631 W Cerritos Ave
- 9041 Stacie Ln Unit 12
- 10301 Antigua St
- 8921 Kennelly Ln
- 9592 Katella Ave
- 927 S Webster Ave
- 8971 Poinsettia Ln
- 1765 S Biscayne Ct
- 11172 Homeway Dr
- 998 S Crossbow Ln Unit 12D
- 837 S Magnolia Ave
- 958 S Crossbow Ln Unit 8
- 9552 Dewey Dr
- 2517 W Merle Place
- 10211 Macduff St
- 9291 Harle Ave
- 9321 Harle Ave
- 9281 Harle Ave
- 9302 Cerritos Ave
- 9331 Harle Ave
- 9312 Cerritos Ave
- 9302 Harle Ave
- 9292 Harle Ave
- 9322 Harle Ave
- 9282 Cerritos Ave
- 9332 Cerritos Ave
- 9261 Harle Ave
- 9282 Harle Ave
- 9332 Harle Ave
- 9332 W Harle Ave
- 9342 Cerritos Ave
- 9262 Harle Ave
- 9251 Harle Ave
- 9301 Tina Way
- 9342 Harle Ave