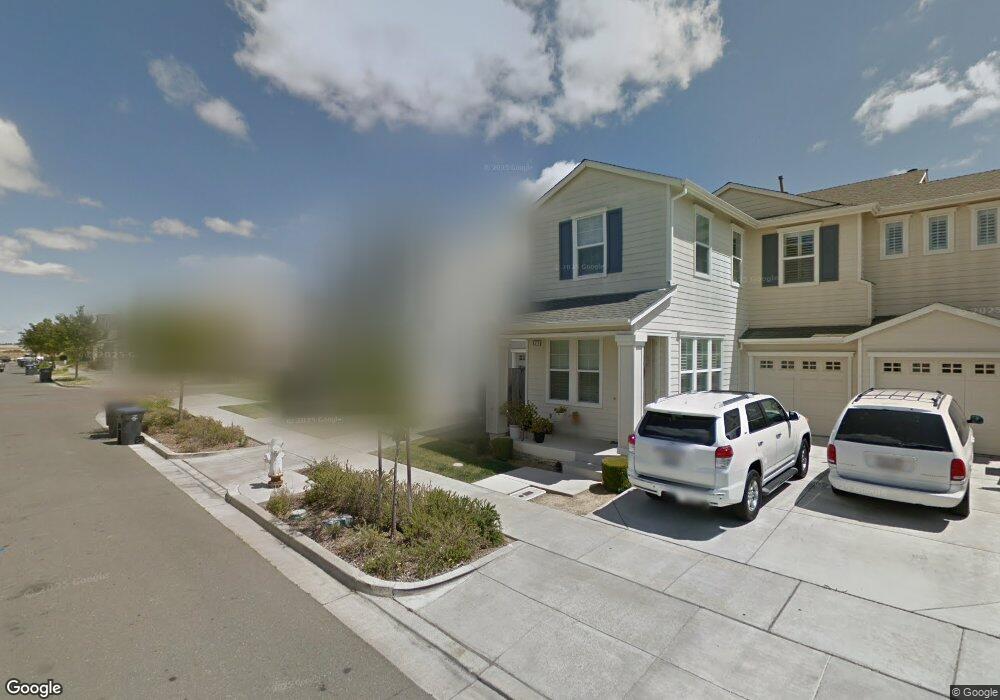
931 Liberty Dr Suisun City, CA 94585
Estimated Value: $550,319 - $580,000
3
Beds
3
Baths
1,761
Sq Ft
$321/Sq Ft
Est. Value
About This Home
This home is located at 931 Liberty Dr, Suisun City, CA 94585 and is currently estimated at $565,330, approximately $321 per square foot. 931 Liberty Dr is a home located in Solano County with nearby schools including Crescent Elementary School, Crystal Middle School, and Armijo High School.
Ownership History
Date
Name
Owned For
Owner Type
Purchase Details
Closed on
Dec 14, 2009
Sold by
Whalen Jenelle and Winkler Brian
Bought by
Garcia Ii Romeo F and Garcia Cherry Ann C
Current Estimated Value
Home Financials for this Owner
Home Financials are based on the most recent Mortgage that was taken out on this home.
Original Mortgage
$220,924
Outstanding Balance
$144,173
Interest Rate
4.91%
Mortgage Type
FHA
Estimated Equity
$421,157
Purchase Details
Closed on
May 27, 2005
Sold by
New America Homes/Md89 Inc
Bought by
Whalen Jenelle and Winkler Brian
Home Financials for this Owner
Home Financials are based on the most recent Mortgage that was taken out on this home.
Original Mortgage
$85,600
Interest Rate
5.84%
Mortgage Type
Credit Line Revolving
Create a Home Valuation Report for This Property
The Home Valuation Report is an in-depth analysis detailing your home's value as well as a comparison with similar homes in the area
Home Values in the Area
Average Home Value in this Area
Purchase History
| Date | Buyer | Sale Price | Title Company |
|---|---|---|---|
| Garcia Ii Romeo F | $225,000 | Placer Title Company | |
| Whalen Jenelle | $432,500 | First American Title Co |
Source: Public Records
Mortgage History
| Date | Status | Borrower | Loan Amount |
|---|---|---|---|
| Open | Garcia Ii Romeo F | $220,924 | |
| Previous Owner | Whalen Jenelle | $85,600 | |
| Previous Owner | Whalen Jenelle | $345,636 |
Source: Public Records
Tax History Compared to Growth
Tax History
| Year | Tax Paid | Tax Assessment Tax Assessment Total Assessment is a certain percentage of the fair market value that is determined by local assessors to be the total taxable value of land and additions on the property. | Land | Improvement |
|---|---|---|---|---|
| 2025 | $4,488 | $290,425 | $83,896 | $206,529 |
| 2024 | $4,488 | $284,731 | $82,251 | $202,480 |
| 2023 | $4,375 | $279,149 | $80,639 | $198,510 |
| 2022 | $4,319 | $273,676 | $79,059 | $194,617 |
| 2021 | $4,123 | $268,310 | $77,509 | $190,801 |
| 2020 | $4,023 | $265,560 | $76,715 | $188,845 |
| 2019 | $3,906 | $260,354 | $75,211 | $185,143 |
| 2018 | $4,001 | $255,250 | $73,737 | $181,513 |
| 2017 | $3,837 | $250,246 | $72,292 | $177,954 |
| 2016 | $3,801 | $245,340 | $70,875 | $174,465 |
| 2015 | $3,580 | $241,656 | $69,811 | $171,845 |
| 2014 | $3,538 | $236,923 | $68,444 | $168,479 |
Source: Public Records
Map
Nearby Homes