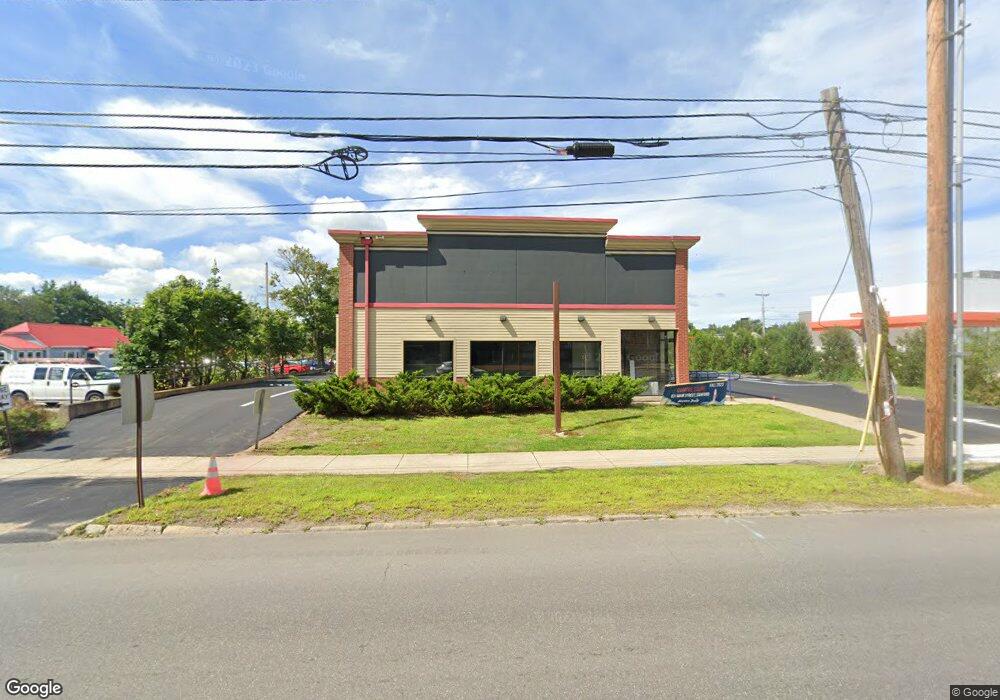
931 Main St Sanford, ME 04073
--
Bed
1
Bath
1,880
Sq Ft
0.58
Acres
About This Home
This home is located at 931 Main St, Sanford, ME 04073. 931 Main St is a home located in York County with nearby schools including Sanford Christian Academy and St Thomas Consolidated School.
Ownership History
Date
Name
Owned For
Owner Type
Purchase Details
Closed on
Feb 10, 2020
Sold by
Belmont C E
Bought by
Rmb & Associates Llc
Home Financials for this Owner
Home Financials are based on the most recent Mortgage that was taken out on this home.
Original Mortgage
$344,000
Outstanding Balance
$304,113
Interest Rate
3.74%
Mortgage Type
New Conventional
Create a Home Valuation Report for This Property
The Home Valuation Report is an in-depth analysis detailing your home's value as well as a comparison with similar homes in the area
Home Values in the Area
Average Home Value in this Area
Purchase History
| Date | Buyer | Sale Price | Title Company |
|---|---|---|---|
| Rmb & Associates Llc | -- | None Available | |
| Rmb & Associates Llc | -- | None Available | |
| Rmb & Associates Llc | -- | None Available |
Source: Public Records
Mortgage History
| Date | Status | Borrower | Loan Amount |
|---|---|---|---|
| Open | Rmb & Associates Llc | $344,000 | |
| Closed | Rmb & Associates Llc | $344,000 |
Source: Public Records
Tax History Compared to Growth
Tax History
| Year | Tax Paid | Tax Assessment Tax Assessment Total Assessment is a certain percentage of the fair market value that is determined by local assessors to be the total taxable value of land and additions on the property. | Land | Improvement |
|---|---|---|---|---|
| 2025 | $8,181 | $478,400 | $202,300 | $276,100 |
| 2024 | $7,768 | $481,300 | $202,300 | $279,000 |
| 2023 | $7,287 | $481,300 | $202,300 | $279,000 |
| 2022 | $7,123 | $481,300 | $202,300 | $279,000 |
| 2021 | $6,799 | $374,000 | $202,300 | $171,700 |
| 2020 | $7,540 | $374,000 | $202,300 | $171,700 |
| 2019 | $6,504 | $314,200 | $202,300 | $111,900 |
| 2018 | $6,453 | $314,200 | $202,300 | $111,900 |
| 2017 | $6,517 | $314,200 | $202,300 | $111,900 |
| 2016 | $6,588 | $289,700 | $158,900 | $130,800 |
| 2015 | $6,453 | $292,800 | $158,900 | $133,900 |
| 2014 | $5,731 | $296,000 | $158,900 | $137,100 |
| 2013 | -- | $265,100 | $158,900 | $106,200 |
Source: Public Records
Map
Nearby Homes
- 10 Bodwell St
- 28 Elm St
- 18 Bodwell St
- 19 Bodwell St Unit 3
- 19 Bodwell St Unit 5
- 19 Bodwell St Unit 7
- 19 Bodwell St Unit 8
- 19 Bodwell St Unit 4
- 19 Bodwell St Unit 6
- 19 Bodwell St Unit 1
- 19 Bodwell St Unit 2
- 19 Bodwell St Unit 9
- 33 Kimball St
- 5 Shaw St
- 37 Weymouth St
- 17 Twombley Rd
- 1 Kempton Terrace
- 126 Jackson St
- 6 Dudley St
- 1013 Main St