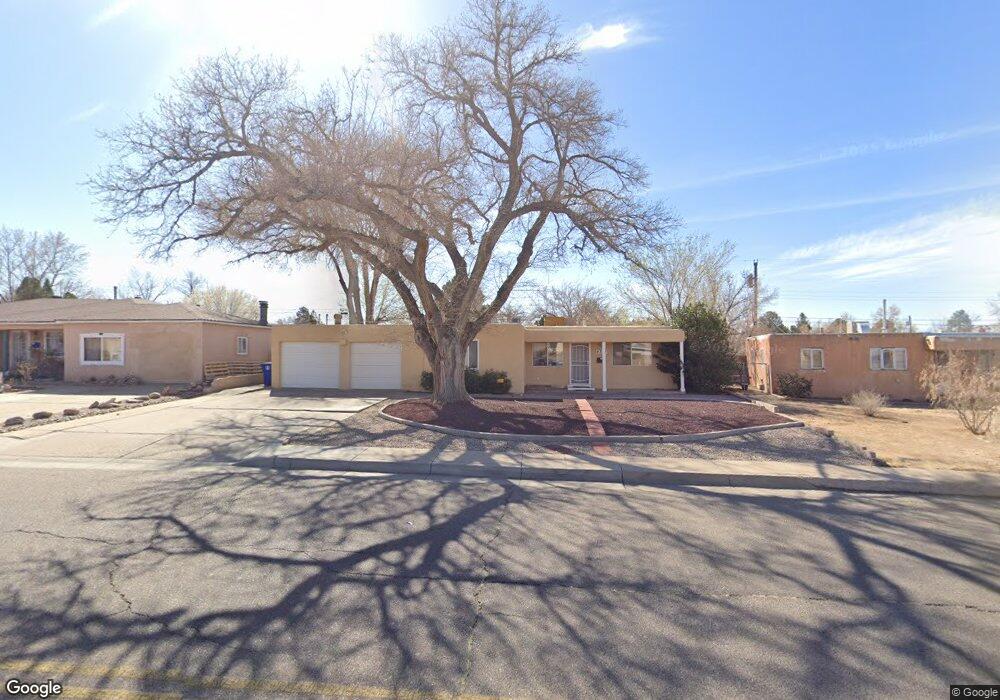
9310 Snowheights Blvd NE Albuquerque, NM 87112
North Easterns NeighborhoodEstimated Value: $290,000 - $311,000
3
Beds
2
Baths
1,480
Sq Ft
$206/Sq Ft
Est. Value
About This Home
This home is located at 9310 Snowheights Blvd NE, Albuquerque, NM 87112 and is currently estimated at $304,249, approximately $205 per square foot. 9310 Snowheights Blvd NE is a home located in Bernalillo County with nearby schools including Janet Kahn School of Integrated Arts, Grant Middle School, and Sandia High School.
Ownership History
Date
Name
Owned For
Owner Type
Purchase Details
Closed on
Mar 2, 2016
Sold by
Buster Craig J
Bought by
Clement Tierney E and Clement John
Current Estimated Value
Home Financials for this Owner
Home Financials are based on the most recent Mortgage that was taken out on this home.
Original Mortgage
$137,362
Outstanding Balance
$108,786
Interest Rate
3.75%
Mortgage Type
FHA
Estimated Equity
$195,463
Purchase Details
Closed on
Jul 14, 2005
Sold by
Buster Terry L and Buster Georgia L
Bought by
Buster Craig J
Home Financials for this Owner
Home Financials are based on the most recent Mortgage that was taken out on this home.
Original Mortgage
$90,000
Interest Rate
5.64%
Mortgage Type
Fannie Mae Freddie Mac
Purchase Details
Closed on
May 18, 2001
Sold by
Benton Patricia L
Bought by
Buster Terry L and Buster Georgia L
Home Financials for this Owner
Home Financials are based on the most recent Mortgage that was taken out on this home.
Original Mortgage
$93,000
Interest Rate
6.99%
Create a Home Valuation Report for This Property
The Home Valuation Report is an in-depth analysis detailing your home's value as well as a comparison with similar homes in the area
Home Values in the Area
Average Home Value in this Area
Purchase History
| Date | Buyer | Sale Price | Title Company |
|---|---|---|---|
| Clement Tierney E | -- | None Available | |
| Buster Craig J | -- | Commerce Title Co Of Nm Llc | |
| Buster Terry L | -- | Albuquerque Title |
Source: Public Records
Mortgage History
| Date | Status | Borrower | Loan Amount |
|---|---|---|---|
| Open | Clement Tierney E | $137,362 | |
| Previous Owner | Buster Craig J | $90,000 | |
| Previous Owner | Buster Terry L | $93,000 |
Source: Public Records
Tax History Compared to Growth
Tax History
| Year | Tax Paid | Tax Assessment Tax Assessment Total Assessment is a certain percentage of the fair market value that is determined by local assessors to be the total taxable value of land and additions on the property. | Land | Improvement |
|---|---|---|---|---|
| 2025 | $2,342 | $59,231 | $14,025 | $45,206 |
| 2024 | $2,342 | $57,507 | $13,617 | $43,890 |
| 2023 | $2,300 | $55,832 | $13,220 | $42,612 |
| 2022 | $2,221 | $54,206 | $12,835 | $41,371 |
| 2021 | $2,143 | $52,628 | $12,462 | $40,166 |
| 2020 | $2,106 | $51,095 | $12,099 | $38,996 |
| 2019 | $2,065 | $50,162 | $12,099 | $38,063 |
| 2018 | $2,052 | $50,162 | $12,099 | $38,063 |
| 2017 | $2,048 | $50,162 | $12,099 | $38,063 |
| 2016 | $1,848 | $45,425 | $10,880 | $34,545 |
| 2015 | $44,103 | $44,103 | $10,564 | $33,539 |
| 2014 | $1,818 | $42,819 | $10,256 | $32,563 |
| 2013 | -- | $41,572 | $9,957 | $31,615 |
Source: Public Records
Map
Nearby Homes
- 9521 Snow Heights Blvd NE
- 2014 Somervell St NE
- 9616 Morrow Ave NE
- 9405 Cyndi Ct
- 9716 Indian School Rd NE
- 1800 Field Dr NE
- 1820 Lester Dr NE
- 1724 Glorieta St NE
- 9521 Salem Rd NE
- 8623 Menaul Blvd NE
- 1812 Mary Ellen St NE
- 1613 Glorieta St NE
- 8922 Claremont Ave NE
- 8902 Claremont Ave NE
- 8501 Bellehaven Place NE
- 1800 Pitt St NE
- 2057 Virginia St NE
- 1833 Britt St NE
- 2026 Vermont St NE
- 2700 Eubank Blvd NE
- 9310 Snow Heights Blvd NE
- 9316 Snowheights Blvd NE
- 9316 Snow Heights Blvd NE
- 9304 Snowheights Blvd NE
- 9311 Arvada Ave NE
- 9400 Snowheights Blvd NE
- 9307 Arvada Ave NE
- 9300 Snowheights Blvd NE
- 9315 Arvada Ave NE
- 9301 Arvada Ave NE
- 9313 Snowheights Blvd NE
- 9313 Snow Heights Blvd NE
- 9309 Snowheights Blvd NE
- 9221 Arvada Ave NE
- 9401 Arvada Ave NE
- 2000 Erbbe St NE
- 9216 Snowheights Blvd NE
- 9405 Arvada Ave NE
- 9406 Snowheights Blvd NE
- 9319 Snow Heights Blvd NE