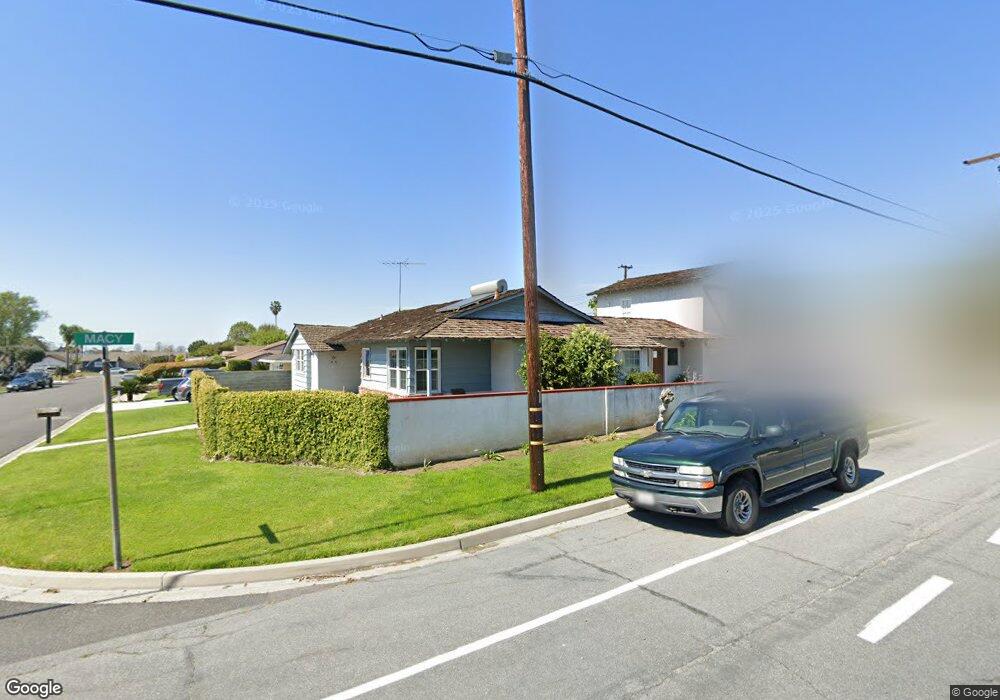
9321 Wallace Ave La Habra, CA 90631
Estimated Value: $1,100,000 - $1,316,000
3
Beds
2
Baths
2,694
Sq Ft
$443/Sq Ft
Est. Value
About This Home
This home is located at 9321 Wallace Ave, La Habra, CA 90631 and is currently estimated at $1,193,706, approximately $443 per square foot. 9321 Wallace Ave is a home located in Orange County with nearby schools including Macy Elementary School, Rancho-Starbuck Intermediate School, and La Habra High School.
Ownership History
Date
Name
Owned For
Owner Type
Purchase Details
Closed on
Aug 2, 2024
Sold by
Gaynor Kenneth Michael and Gaynor Belinda
Bought by
Gaynor Kenneth Michael and Gaynor Belinda
Current Estimated Value
Purchase Details
Closed on
Sep 28, 1998
Sold by
Matthew Mclinden and Matthew Alice M
Bought by
Gaynor Kenneth Michael and Gaynor Belinda
Home Financials for this Owner
Home Financials are based on the most recent Mortgage that was taken out on this home.
Original Mortgage
$220,500
Interest Rate
6.88%
Purchase Details
Closed on
Aug 16, 1996
Sold by
Matthew Mclinden and Matthew Alice M
Bought by
Mclinden Matthew J and Mclinden Alice M
Purchase Details
Closed on
Mar 10, 1994
Sold by
Salazar Alice M and Dibonaventura John
Bought by
Mclinden Matthew J and Salazar Alice M
Home Financials for this Owner
Home Financials are based on the most recent Mortgage that was taken out on this home.
Original Mortgage
$202,500
Interest Rate
7.15%
Create a Home Valuation Report for This Property
The Home Valuation Report is an in-depth analysis detailing your home's value as well as a comparison with similar homes in the area
Home Values in the Area
Average Home Value in this Area
Purchase History
| Date | Buyer | Sale Price | Title Company |
|---|---|---|---|
| Gaynor Kenneth Michael | -- | None Listed On Document | |
| Gaynor Kenneth Michael | $245,000 | Orange Coast Title | |
| Mclinden Matthew J | -- | -- | |
| Mclinden Matthew J | -- | South Coast Title Company |
Source: Public Records
Mortgage History
| Date | Status | Borrower | Loan Amount |
|---|---|---|---|
| Previous Owner | Gaynor Kenneth Michael | $220,500 | |
| Previous Owner | Mclinden Matthew J | $202,500 |
Source: Public Records
Tax History Compared to Growth
Tax History
| Year | Tax Paid | Tax Assessment Tax Assessment Total Assessment is a certain percentage of the fair market value that is determined by local assessors to be the total taxable value of land and additions on the property. | Land | Improvement |
|---|---|---|---|---|
| 2025 | $4,061 | $384,081 | $199,896 | $184,185 |
| 2024 | $4,061 | $376,550 | $195,976 | $180,574 |
| 2023 | $3,968 | $369,167 | $192,133 | $177,034 |
| 2022 | $3,934 | $361,929 | $188,366 | $173,563 |
| 2021 | $3,854 | $354,833 | $184,673 | $170,160 |
| 2020 | $3,849 | $351,195 | $182,779 | $168,416 |
| 2019 | $3,753 | $344,309 | $179,195 | $165,114 |
| 2018 | $3,600 | $337,558 | $175,681 | $161,877 |
| 2017 | $3,536 | $330,940 | $172,237 | $158,703 |
| 2016 | $3,460 | $324,451 | $168,859 | $155,592 |
| 2015 | $3,362 | $319,578 | $166,323 | $153,255 |
| 2014 | $3,256 | $313,318 | $163,065 | $150,253 |
Source: Public Records
Map
Nearby Homes
- 9331 Mikinda Ave
- 9422 Canfield Dr
- 2311 Canfield Dr
- 1000 Dolores St
- 2401 Canfield Dr
- 9915 Corella Ave
- 16875 Sausalito Dr
- 2100 Gregory Ln
- 16540 Whittier Blvd
- 2611 Gregory Ln
- 10303 Pounds Ave
- 16635 Monte Oro Dr
- 188 Madelena Dr
- 1230 Sunbird Ave
- 1620 W El Portal Dr
- 401 Granada Dr
- 10418 Bogardus Ave
- 1436 La Riata Dr
- 1320 Marlei Rd
- 1020 La Serna Ave
- 9311 Wallace Ave
- 9322 Gordon Ave
- 9312 Gordon Ave
- 9291 Wallace Ave
- 1242 Macy St
- 1222 Macy St
- 9322 Wallace Ave
- 9312 Wallace Ave
- 1252 Macy St
- 1212 Macy St
- 9292 Gordon Ave
- 1202 Macy St
- 9292 Wallace Ave
- 1272 Macy St Unit SR
- 1272 Macy St
- 9281 Wallace Ave
- 9385 Randall Ave
- 9282 Gordon Ave
- 1231 Macy St
- 9321 Randall Ave