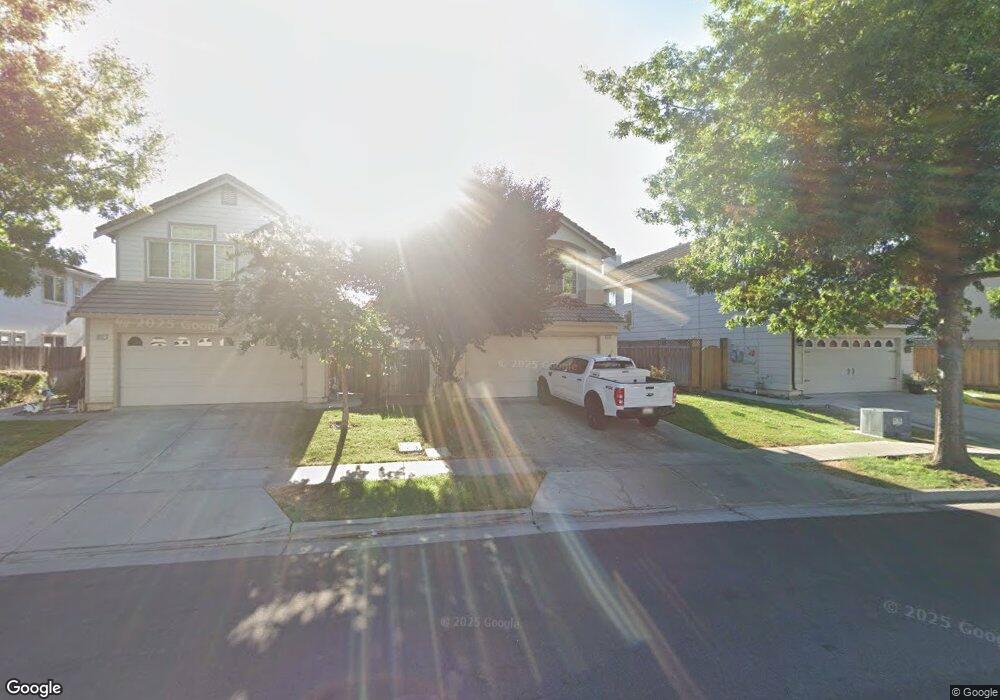
9336 Lariat Dr Gilroy, CA 95020
Las Animas NeighborhoodEstimated Value: $843,621 - $967,000
3
Beds
3
Baths
1,397
Sq Ft
$664/Sq Ft
Est. Value
About This Home
This home is located at 9336 Lariat Dr, Gilroy, CA 95020 and is currently estimated at $927,405, approximately $663 per square foot. 9336 Lariat Dr is a home located in Santa Clara County with nearby schools including Luigi Aprea Elementary School, Brownell Middle School, and Solorsano Middle School.
Ownership History
Date
Name
Owned For
Owner Type
Purchase Details
Closed on
Apr 17, 2007
Sold by
Taves Nancy
Bought by
Taves Phillip R
Current Estimated Value
Home Financials for this Owner
Home Financials are based on the most recent Mortgage that was taken out on this home.
Original Mortgage
$292,000
Outstanding Balance
$176,259
Interest Rate
6.12%
Mortgage Type
New Conventional
Estimated Equity
$751,146
Purchase Details
Closed on
Aug 12, 2003
Sold by
Taves Milara C
Bought by
Taves Phillip R
Home Financials for this Owner
Home Financials are based on the most recent Mortgage that was taken out on this home.
Original Mortgage
$298,200
Interest Rate
4.62%
Mortgage Type
Purchase Money Mortgage
Purchase Details
Closed on
Sep 10, 1997
Sold by
Valley Title Co
Bought by
Taves Phillip R and Taves Milara C
Home Financials for this Owner
Home Financials are based on the most recent Mortgage that was taken out on this home.
Original Mortgage
$199,100
Interest Rate
7.34%
Create a Home Valuation Report for This Property
The Home Valuation Report is an in-depth analysis detailing your home's value as well as a comparison with similar homes in the area
Home Values in the Area
Average Home Value in this Area
Purchase History
| Date | Buyer | Sale Price | Title Company |
|---|---|---|---|
| Taves Phillip R | -- | Placer Title Company | |
| Taves Phillip R | -- | Stewart Title Of California | |
| Taves Phillip R | $215,000 | Golden California Title Co |
Source: Public Records
Mortgage History
| Date | Status | Borrower | Loan Amount |
|---|---|---|---|
| Open | Taves Phillip R | $292,000 | |
| Closed | Taves Phillip R | $298,200 | |
| Closed | Taves Phillip R | $199,100 |
Source: Public Records
Tax History Compared to Growth
Tax History
| Year | Tax Paid | Tax Assessment Tax Assessment Total Assessment is a certain percentage of the fair market value that is determined by local assessors to be the total taxable value of land and additions on the property. | Land | Improvement |
|---|---|---|---|---|
| 2025 | $4,256 | $343,279 | $159,665 | $183,614 |
| 2024 | $4,256 | $336,549 | $156,535 | $180,014 |
| 2023 | $4,231 | $329,951 | $153,466 | $176,485 |
| 2022 | $4,161 | $323,482 | $150,457 | $173,025 |
| 2021 | $4,141 | $317,140 | $147,507 | $169,633 |
| 2020 | $4,095 | $313,889 | $145,995 | $167,894 |
| 2019 | $4,058 | $307,735 | $143,133 | $164,602 |
| 2018 | $3,792 | $301,702 | $140,327 | $161,375 |
| 2017 | $3,870 | $295,787 | $137,576 | $158,211 |
| 2016 | $3,787 | $289,988 | $134,879 | $155,109 |
| 2015 | $3,575 | $285,633 | $132,853 | $152,780 |
| 2014 | $3,552 | $280,039 | $130,251 | $149,788 |
Source: Public Records
Map
Nearby Homes
- 9632 Cherrywood Ct
- 820 Woodcreek Way
- 1080 Sunrise Dr
- 1206 Sycamore Ct
- 670 Wickham Ct
- 1469 Eagles Nest Ln
- 1486 Swallow Ln
- 1469 Goshawk Ct
- 1482 Goshawk Ct
- 9850 Bobcat Ct
- 264 Windsong Way
- 9232 Kestrel Ct
- 1297 Chesbro Way
- 1620 Welburn Ave
- 8940 Acorn Way
- 1180 Day Rd
- 9135 Desiderio Way
- 119 Farrell Ave
- 103 Farrell Ave
- 111 Farrell Ave
- 9332 Lariat Dr
- 9342 Lariat Dr
- 9352 Lariat Dr
- 9322 Lariat Dr
- 9343 Benbow Dr
- 9353 Benbow Dr
- 9333 Benbow Dr
- 9356 Lariat Dr
- 9316 Lariat Dr
- 9363 Benbow Dr
- 1025 Sage Hill Dr
- 1005 Sage Hill Dr
- 9373 Benbow Dr
- 9362 Lariat Dr
- 9312 Lariat Dr
- 9345 Lariat Dr
- 995 Sage Hill Dr
- 9355 Lariat Dr
- 9335 Lariat Dr
- 9383 Benbow Dr