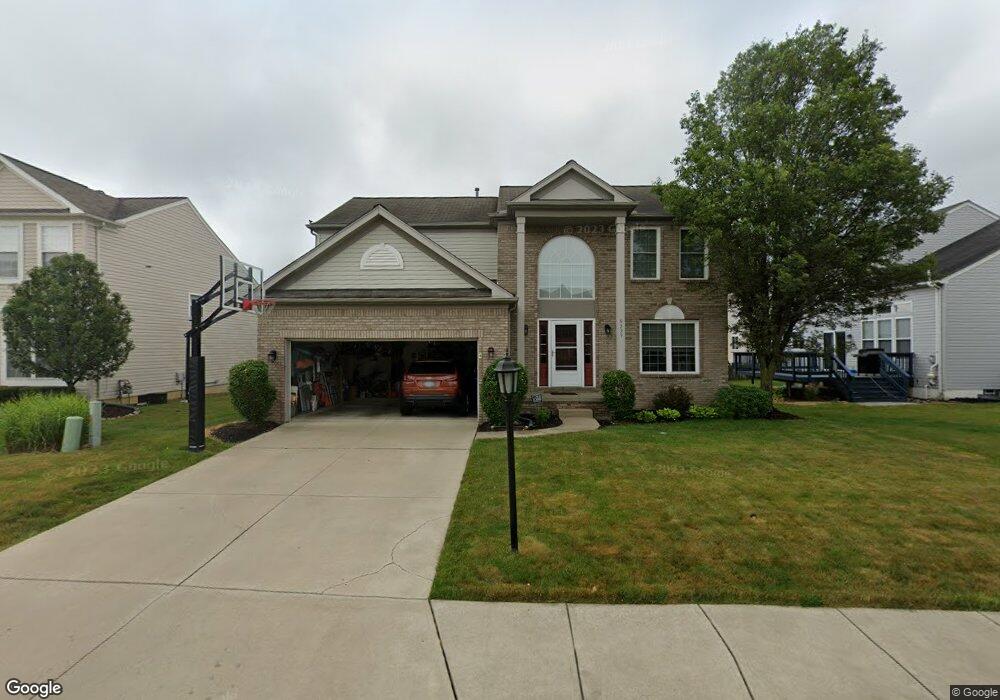
9339 Saybrook Dr North Ridgeville, OH 44039
Estimated Value: $300,000 - $372,000
4
Beds
3
Baths
2,030
Sq Ft
$172/Sq Ft
Est. Value
About This Home
This home is located at 9339 Saybrook Dr, North Ridgeville, OH 44039 and is currently estimated at $348,290, approximately $171 per square foot. 9339 Saybrook Dr is a home located in Lorain County with nearby schools including North Ridgeville Academic Center, Liberty Elementary School, and Ranger High Tech Academy.
Ownership History
Date
Name
Owned For
Owner Type
Purchase Details
Closed on
Jan 15, 2009
Sold by
Sroka R Jason and Sroka Megan
Bought by
Sroka Megan
Current Estimated Value
Purchase Details
Closed on
May 30, 2006
Sold by
Mangan Erin K
Bought by
Sroka R Jason and Sroka Megan
Home Financials for this Owner
Home Financials are based on the most recent Mortgage that was taken out on this home.
Original Mortgage
$164,800
Outstanding Balance
$97,160
Interest Rate
6.62%
Mortgage Type
Fannie Mae Freddie Mac
Estimated Equity
$251,130
Purchase Details
Closed on
Jul 17, 2003
Sold by
Pulte Homes Of Ohio Llc
Bought by
Mangan Erin K
Home Financials for this Owner
Home Financials are based on the most recent Mortgage that was taken out on this home.
Original Mortgage
$174,840
Interest Rate
6.04%
Mortgage Type
Purchase Money Mortgage
Create a Home Valuation Report for This Property
The Home Valuation Report is an in-depth analysis detailing your home's value as well as a comparison with similar homes in the area
Home Values in the Area
Average Home Value in this Area
Purchase History
| Date | Buyer | Sale Price | Title Company |
|---|---|---|---|
| Sroka Megan | -- | None Available | |
| Sroka R Jason | $206,000 | Revere Title Agency | |
| Mangan Erin K | $218,600 | Pulte Title Agency Llc |
Source: Public Records
Mortgage History
| Date | Status | Borrower | Loan Amount |
|---|---|---|---|
| Open | Sroka R Jason | $164,800 | |
| Previous Owner | Mangan Erin K | $174,840 |
Source: Public Records
Tax History Compared to Growth
Tax History
| Year | Tax Paid | Tax Assessment Tax Assessment Total Assessment is a certain percentage of the fair market value that is determined by local assessors to be the total taxable value of land and additions on the property. | Land | Improvement |
|---|---|---|---|---|
| 2024 | $4,968 | $97,328 | $29,750 | $67,578 |
| 2023 | $4,618 | $79,916 | $20,920 | $58,996 |
| 2022 | $4,145 | $79,916 | $20,920 | $58,996 |
| 2021 | $4,161 | $79,916 | $20,920 | $58,996 |
| 2020 | $3,892 | $69,130 | $18,100 | $51,030 |
| 2019 | $3,884 | $69,130 | $18,100 | $51,030 |
| 2018 | $3,885 | $69,130 | $18,100 | $51,030 |
| 2017 | $3,776 | $62,300 | $11,330 | $50,970 |
| 2016 | $3,834 | $62,300 | $11,330 | $50,970 |
| 2015 | $3,889 | $62,300 | $11,330 | $50,970 |
| 2014 | $3,756 | $58,500 | $10,640 | $47,860 |
| 2013 | $3,793 | $58,500 | $10,640 | $47,860 |
Source: Public Records
Map
Nearby Homes
- 9339 Calista Dr
- 37006 Fairfield Ln Unit A2
- 9361 Winfield Ln
- 9307 Calista Dr
- 9358 Nash Ln
- 9088 Stonegate Cir
- 37058 Danforth Ct
- 9162 Vernon Hill
- 601 Cedar Crest Dr
- 9094 Franklin Dr
- 367 Wescott Way
- 37530 Terrell Dr
- 327 Breckenridge Oval Unit 9
- 110 Carrington Ct
- 167 Prestwyck Ln
- 8890 Jordan Ct
- 144 Prestwyck Ln
- 202 Queensbury Run
- 9180 Bender Rd
- 210 Queensbury Run
- 9335 Saybrook Dr
- 9345 Saybrook Dr
- 9354 Saybrook Dr
- 9331 Saybrook Dr
- 37148 Bolton Dr
- 9362 Saybrook Dr
- 9336 Saybrook Dr
- 9327 Saybrook Dr
- 9332 Saybrook Dr
- 9340 Saybrook Dr
- 37132 Bolton Dr
- 37156 Bolton Dr
- 9344 Saybrook Dr
- 37164 Bolton Dr
- 9324 Saybrook Dr
- 9323 Saybrook Dr
- 9319 Saybrook Dr
- 9359 Saybrook Dr
- 9355 Saybrook Dr
- 9363 Saybrook Dr