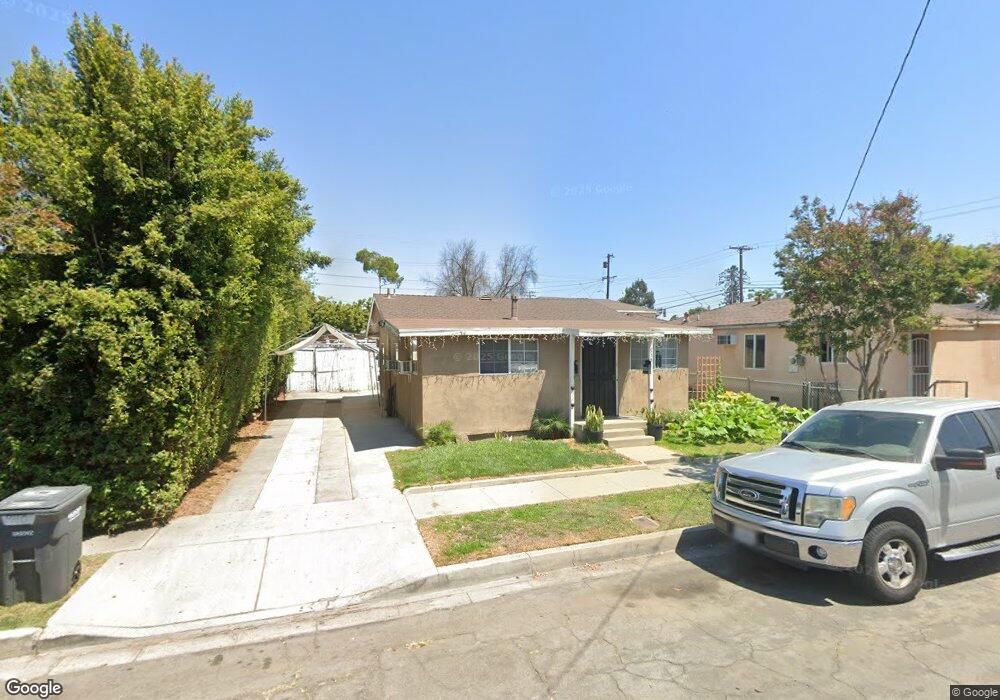
935 E Vernon St Signal Hill, CA 90755
Estimated Value: $703,000 - $822,000
3
Beds
2
Baths
1,458
Sq Ft
$529/Sq Ft
Est. Value
About This Home
This home is located at 935 E Vernon St, Signal Hill, CA 90755 and is currently estimated at $770,963, approximately $528 per square foot. 935 E Vernon St is a home located in Los Angeles County with nearby schools including Signal Hill Elementary School, Nelson Academy, and Long Beach Polytechnic High School.
Ownership History
Date
Name
Owned For
Owner Type
Purchase Details
Closed on
May 2, 2013
Sold by
Alonso Maximino and Alonso Maria A
Bought by
Alonso Maria D
Current Estimated Value
Purchase Details
Closed on
Jul 26, 2000
Sold by
Rendon Jesus and Perez Clotilde
Bought by
Alonso Maria A and Alonso Maximino
Home Financials for this Owner
Home Financials are based on the most recent Mortgage that was taken out on this home.
Original Mortgage
$98,890
Outstanding Balance
$37,547
Interest Rate
8.89%
Estimated Equity
$733,417
Purchase Details
Closed on
Mar 26, 1996
Sold by
Southern California Assn Of Seventh Day
Bought by
Mcclanahan Jessie H and Mcclanahan Russell
Purchase Details
Closed on
Jan 3, 1996
Sold by
Crow Jean Lynn and The Crow Family Trust
Bought by
Rendon Primitivo
Home Financials for this Owner
Home Financials are based on the most recent Mortgage that was taken out on this home.
Original Mortgage
$64,000
Interest Rate
7.41%
Create a Home Valuation Report for This Property
The Home Valuation Report is an in-depth analysis detailing your home's value as well as a comparison with similar homes in the area
Home Values in the Area
Average Home Value in this Area
Purchase History
| Date | Buyer | Sale Price | Title Company |
|---|---|---|---|
| Alonso Maria D | -- | None Available | |
| Alonso Maria A | $121,000 | Fidelity Title | |
| Mcclanahan Jessie H | -- | Southland Title Corporation | |
| Rendon Primitivo | $80,000 | Southland Title Corporation |
Source: Public Records
Mortgage History
| Date | Status | Borrower | Loan Amount |
|---|---|---|---|
| Open | Alonso Maria A | $98,890 | |
| Previous Owner | Rendon Primitivo | $64,000 |
Source: Public Records
Tax History Compared to Growth
Tax History
| Year | Tax Paid | Tax Assessment Tax Assessment Total Assessment is a certain percentage of the fair market value that is determined by local assessors to be the total taxable value of land and additions on the property. | Land | Improvement |
|---|---|---|---|---|
| 2025 | $4,317 | $288,168 | $182,025 | $106,143 |
| 2024 | $4,317 | $282,518 | $178,456 | $104,062 |
| 2023 | $4,247 | $276,979 | $174,957 | $102,022 |
| 2022 | $4,011 | $271,549 | $171,527 | $100,022 |
| 2021 | $3,929 | $266,225 | $168,164 | $98,061 |
| 2020 | $3,917 | $263,496 | $166,440 | $97,056 |
| 2019 | $3,877 | $258,330 | $163,177 | $95,153 |
| 2018 | $3,706 | $253,266 | $159,978 | $93,288 |
| 2016 | $3,433 | $243,433 | $153,767 | $89,666 |
| 2015 | $3,316 | $239,778 | $151,458 | $88,320 |
| 2014 | $3,307 | $235,082 | $148,492 | $86,590 |
Source: Public Records
Map
Nearby Homes
- 2370 Lime Ave
- 2366 Linden Ave
- 2225 Olive Ave
- 1460 E Willow St Unit 202
- 2599 Walnut Ave
- 2310 Elm Ave
- 2655 Walnut Ave
- 2100 Martin Luther King Junior Ave
- 2337 Long Beach Blvd
- 211 1/2 E Eagle St
- 2123 Atlantic Ave
- 2430 Gaviota Ave
- 2420 Gaviota Ave
- 1211 E Leigh Ct
- 2051 Orange Ave
- 509 E 21st St
- 2240 Walnut Ave
- 2238 Walnut Ave
- 2553 Pine Ave
- 1015 E 20th St
- 933 E Vernon St
- 967 E Vernon St
- 2581 California Ave
- 925 E Vernon St
- 2533 California Ave Unit 2
- 2535 California Ave Unit 1
- 2531 California Ave Unit 5
- 2537 California Ave
- 2539 California Ave Unit 6
- 2533 California Ave
- 2535 California Ave
- 2525 California Ave Unit 8
- 2527 California Ave
- 2529 California Ave
- 940 E Vernon St
- 928 E Vernon St
- 924 E Vernon St
- 2570 Olive Ave
- 2560 Olive Ave
- 2576 Olive Ave