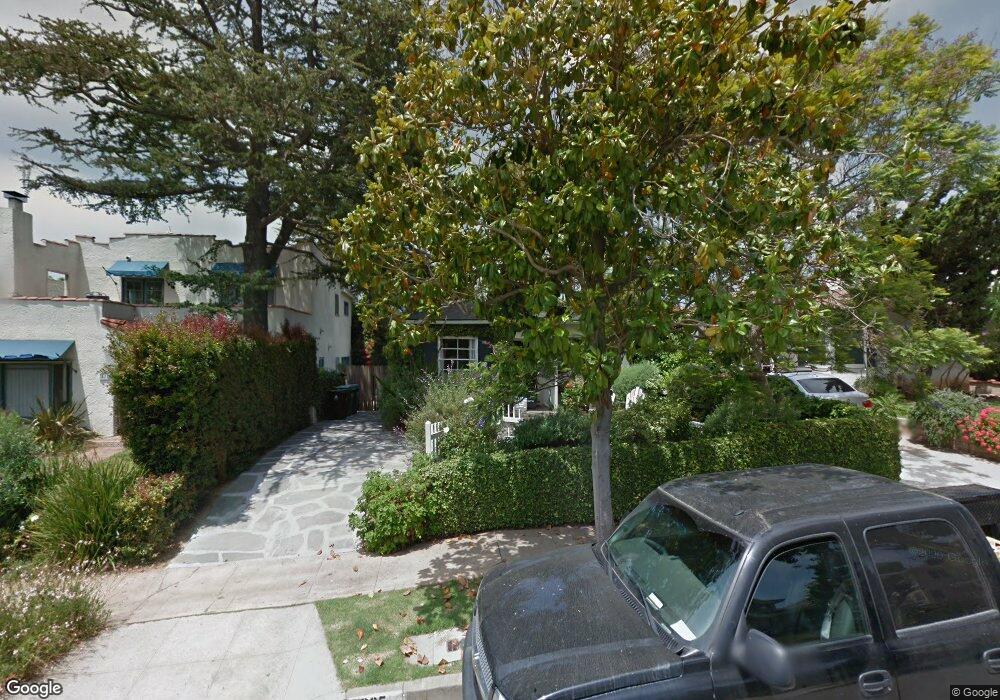
935 Hartzell St Pacific Palisades, CA 90272
Estimated Value: $1,756,000 - $2,644,803
3
Beds
2
Baths
1,106
Sq Ft
$1,893/Sq Ft
Est. Value
About This Home
This home is located at 935 Hartzell St, Pacific Palisades, CA 90272 and is currently estimated at $2,093,601, approximately $1,892 per square foot. 935 Hartzell St is a home located in Los Angeles County with nearby schools including Palisades Charter Elementary, Canyon Charter Elementary, and Paul Revere Charter Middle School.
Ownership History
Date
Name
Owned For
Owner Type
Purchase Details
Closed on
Aug 30, 2014
Sold by
Aikman Robert S
Bought by
Aikman Robert S and Aikman Victoria F
Current Estimated Value
Home Financials for this Owner
Home Financials are based on the most recent Mortgage that was taken out on this home.
Original Mortgage
$870,000
Outstanding Balance
$630,176
Interest Rate
2.75%
Mortgage Type
Adjustable Rate Mortgage/ARM
Estimated Equity
$1,463,425
Purchase Details
Closed on
Aug 23, 2011
Sold by
Alkman Victoria F
Bought by
Aikman Robert S
Purchase Details
Closed on
May 25, 2007
Sold by
Huarte Mariah Jean
Bought by
Aikman Robert S and Aikman Victoria F
Home Financials for this Owner
Home Financials are based on the most recent Mortgage that was taken out on this home.
Original Mortgage
$1,000,000
Interest Rate
6.6%
Mortgage Type
Purchase Money Mortgage
Purchase Details
Closed on
Feb 3, 1998
Sold by
Maher Celia A
Bought by
Maher Celia and The Celia Maher Trust
Create a Home Valuation Report for This Property
The Home Valuation Report is an in-depth analysis detailing your home's value as well as a comparison with similar homes in the area
Home Values in the Area
Average Home Value in this Area
Purchase History
| Date | Buyer | Sale Price | Title Company |
|---|---|---|---|
| Aikman Robert S | -- | Title 365 | |
| Aikman Robert S | -- | First American Title Company | |
| Aikman Robert S | $1,250,000 | Southland Title | |
| Maher Celia | -- | -- |
Source: Public Records
Mortgage History
| Date | Status | Borrower | Loan Amount |
|---|---|---|---|
| Open | Aikman Robert S | $870,000 | |
| Closed | Aikman Robert S | $1,000,000 |
Source: Public Records
Tax History Compared to Growth
Tax History
| Year | Tax Paid | Tax Assessment Tax Assessment Total Assessment is a certain percentage of the fair market value that is determined by local assessors to be the total taxable value of land and additions on the property. | Land | Improvement |
|---|---|---|---|---|
| 2025 | $22,716 | $999,938 | $999,938 | -- |
| 2024 | $22,716 | $1,885,250 | $1,508,201 | $377,049 |
| 2023 | $22,271 | $1,848,285 | $1,478,629 | $369,656 |
| 2022 | $21,225 | $1,812,045 | $1,449,637 | $362,408 |
| 2021 | $20,971 | $1,776,515 | $1,421,213 | $355,302 |
| 2019 | $20,334 | $1,723,824 | $1,379,060 | $344,764 |
| 2018 | $20,273 | $1,690,024 | $1,352,020 | $338,004 |
| 2016 | $19,403 | $1,624,400 | $1,299,520 | $324,880 |
| 2015 | $16,653 | $1,393,461 | $1,114,771 | $278,690 |
| 2014 | $16,703 | $1,366,166 | $1,092,935 | $273,231 |
Source: Public Records
Map
Nearby Homes
- 900 Hartzell St
- 921 Kagawa St
- 1019 Galloway St
- 934 Embury St
- 932 Chautauqua Blvd
- 824 Chautauqua Blvd
- 1111 Hartzell St
- 1046 Chautauqua Blvd
- 14601 Drummond St
- 1101 Chautauqua Blvd
- 14517 W Sunset Blvd
- 14511 W Sunset Blvd
- 1117 Fiske St
- 756 Hartzell St
- 751 Hartzell St
- 909 Rivas Canyon Rd
- 14840 W Sunset Blvd
- 1150 Kagawa St
- 1012 Rivas Canyon Rd
- 800 Alma Real Dr
- 939 Hartzell St
- 931 Hartzell St
- 943 Hartzell St
- 927 Hartzell St
- 947 Hartzell St
- 923 Hartzell St
- 934 Galloway St
- 938 Galloway St
- 930 Galloway St
- 942 Galloway St
- 926 Galloway St
- 951 Hartzell St
- 919 Hartzell St
- 946 Galloway St
- 934 Hartzell St
- 922 Galloway St
- 938 Hartzell St
- 930 Hartzell St
- 942 Hartzell St
- 955 Hartzell St