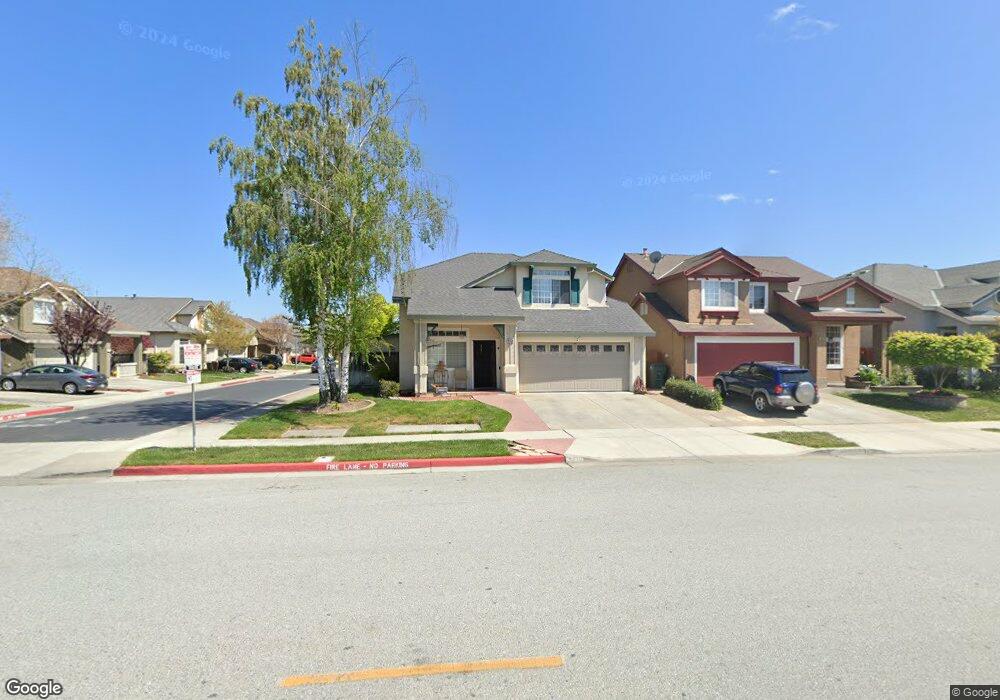
9350 Hirasaki Ave Gilroy, CA 95020
Las Animas NeighborhoodEstimated Value: $804,586 - $942,000
3
Beds
3
Baths
1,269
Sq Ft
$675/Sq Ft
Est. Value
About This Home
This home is located at 9350 Hirasaki Ave, Gilroy, CA 95020 and is currently estimated at $857,147, approximately $675 per square foot. 9350 Hirasaki Ave is a home located in Santa Clara County with nearby schools including Solorsano Middle School, South Valley Middle School, and Christopher High School.
Ownership History
Date
Name
Owned For
Owner Type
Purchase Details
Closed on
Dec 9, 2011
Sold by
Pennucci Nicholas John
Bought by
Pennucci Margaret Ann
Current Estimated Value
Purchase Details
Closed on
Mar 13, 2007
Sold by
Manzo Luis J and Manzo Carmen
Bought by
Pennucci Nicholas John and Pennucci Margaret Ann
Home Financials for this Owner
Home Financials are based on the most recent Mortgage that was taken out on this home.
Original Mortgage
$400,950
Outstanding Balance
$243,088
Interest Rate
6.29%
Mortgage Type
New Conventional
Estimated Equity
$614,059
Purchase Details
Closed on
Oct 6, 1999
Sold by
Longmeadow Drive Associates
Bought by
Manzo Luis J and Manzo Carmen
Home Financials for this Owner
Home Financials are based on the most recent Mortgage that was taken out on this home.
Original Mortgage
$99,918
Interest Rate
7.77%
Mortgage Type
FHA
Create a Home Valuation Report for This Property
The Home Valuation Report is an in-depth analysis detailing your home's value as well as a comparison with similar homes in the area
Home Values in the Area
Average Home Value in this Area
Purchase History
| Date | Buyer | Sale Price | Title Company |
|---|---|---|---|
| Pennucci Margaret Ann | -- | None Available | |
| Pennucci Nicholas John | $635,000 | Chicago Title Company | |
| Manzo Luis J | $185,000 | Chicago Title |
Source: Public Records
Mortgage History
| Date | Status | Borrower | Loan Amount |
|---|---|---|---|
| Open | Pennucci Nicholas John | $400,950 | |
| Previous Owner | Manzo Luis J | $99,918 | |
| Closed | Manzo Luis J | $68,800 |
Source: Public Records
Tax History Compared to Growth
Tax History
| Year | Tax Paid | Tax Assessment Tax Assessment Total Assessment is a certain percentage of the fair market value that is determined by local assessors to be the total taxable value of land and additions on the property. | Land | Improvement |
|---|---|---|---|---|
| 2025 | $6,392 | $528,460 | $267,948 | $260,512 |
| 2024 | $6,392 | $518,099 | $262,695 | $255,404 |
| 2023 | $6,353 | $507,942 | $257,545 | $250,397 |
| 2022 | $6,247 | $497,984 | $252,496 | $245,488 |
| 2021 | $6,217 | $488,221 | $247,546 | $240,675 |
| 2020 | $6,148 | $483,216 | $245,008 | $238,208 |
| 2019 | $6,090 | $473,742 | $240,204 | $233,538 |
| 2018 | $5,686 | $464,454 | $235,495 | $228,959 |
| 2017 | $5,803 | $455,348 | $230,878 | $224,470 |
| 2016 | $5,683 | $446,420 | $226,351 | $220,069 |
| 2015 | $5,365 | $440,000 | $277,200 | $162,800 |
| 2014 | $4,944 | $400,000 | $252,000 | $148,000 |
Source: Public Records
Map
Nearby Homes
- 820 Woodcreek Way
- 670 Wickham Ct
- 9632 Cherrywood Ct
- 1206 Sycamore Ct
- 1080 Sunrise Dr
- 264 Windsong Way
- 9135 Desiderio Way
- 119 Farrell Ave
- 103 Farrell Ave
- 111 Farrell Ave
- 1297 Chesbro Way
- 796 Gary St
- 1469 Goshawk Ct
- 1486 Swallow Ln
- 1482 Goshawk Ct
- 100 Block Ronan Ave
- 1469 Eagles Nest Ln
- 9850 Bobcat Ct
- 201 Ronan Ave
- 958 Bosco Ln Unit 1603
- 9340 Hirasaki Ave
- 895 Morningside Cir
- 9330 Hirasaki Ave
- 885 Morningside Cir
- 891 Woodcreek Way
- 881 Woodcreek Way
- 875 Morningside Cir
- 871 Woodcreek Way
- 9320 Hirasaki Ave
- 9351 Hirasaki Ave
- 865 Morningside Cir
- 9341 Hirasaki Ave
- 861 Woodcreek Way
- 911 Woodcreek Way
- 880 Woodcreek Way
- 9310 Hirasaki Ave
- 9331 Hirasaki Ave
- 861 Morningside Cir
- 855 Woodcreek Way
- 884 Morningside Cir