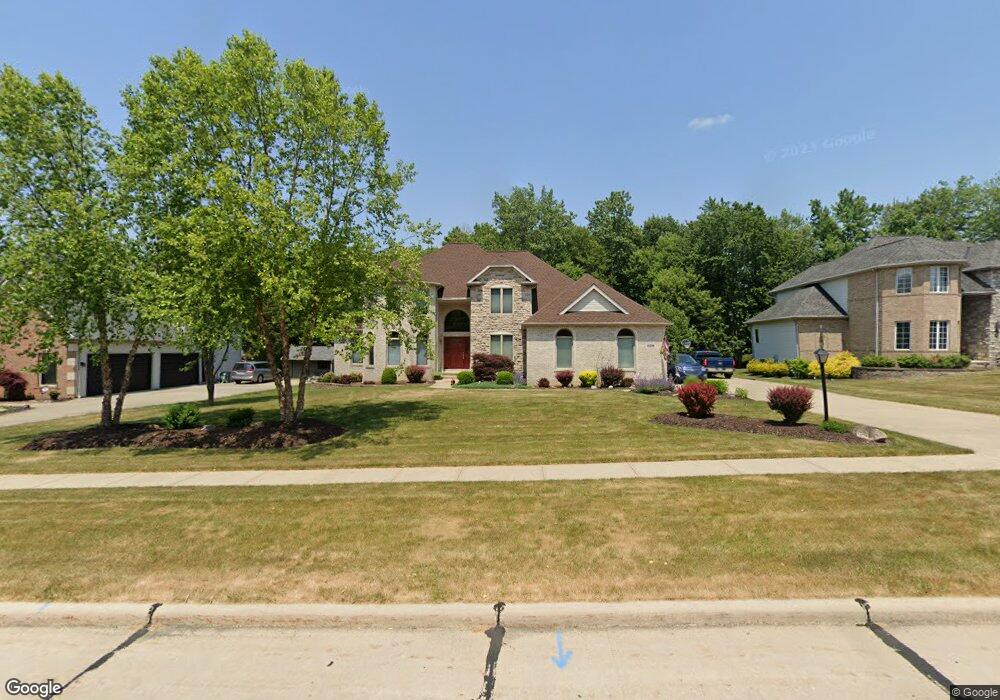
9358 Chesapeake Dr North Royalton, OH 44133
Estimated Value: $612,654 - $670,000
5
Beds
4
Baths
3,809
Sq Ft
$166/Sq Ft
Est. Value
About This Home
This home is located at 9358 Chesapeake Dr, North Royalton, OH 44133 and is currently estimated at $632,164, approximately $165 per square foot. 9358 Chesapeake Dr is a home located in Cuyahoga County with nearby schools including North Royalton Middle School, North Royalton High School, and Saint Albert the Great Roman Catholic School.
Ownership History
Date
Name
Owned For
Owner Type
Purchase Details
Closed on
Jul 28, 2008
Sold by
Matkovic Mario and Matkovic Mira
Bought by
Matkovic Mario and Matkovic Mira
Current Estimated Value
Purchase Details
Closed on
Mar 29, 2003
Sold by
J E Moran Builders Co Inc
Bought by
Kisan Stephen A and Kisan Barbara A
Home Financials for this Owner
Home Financials are based on the most recent Mortgage that was taken out on this home.
Original Mortgage
$267,700
Outstanding Balance
$114,664
Interest Rate
5.71%
Estimated Equity
$517,500
Purchase Details
Closed on
Nov 6, 2002
Sold by
J E Moran Builders Company
Bought by
Matkovic Mario and Matkovic Mira
Home Financials for this Owner
Home Financials are based on the most recent Mortgage that was taken out on this home.
Original Mortgage
$130,000
Interest Rate
6.13%
Purchase Details
Closed on
Apr 2, 2002
Sold by
Tartan Development Company
Bought by
J E Moran Builders Company
Create a Home Valuation Report for This Property
The Home Valuation Report is an in-depth analysis detailing your home's value as well as a comparison with similar homes in the area
Home Values in the Area
Average Home Value in this Area
Purchase History
| Date | Buyer | Sale Price | Title Company |
|---|---|---|---|
| Matkovic Mario | -- | Attorney | |
| Kisan Stephen A | $357,000 | Medina County Title Agency | |
| Matkovic Mario | $356,000 | Medina County Title Agency | |
| J E Moran Builders Company | $78,000 | -- |
Source: Public Records
Mortgage History
| Date | Status | Borrower | Loan Amount |
|---|---|---|---|
| Open | Kisan Stephen A | $267,700 | |
| Closed | Matkovic Mario | $130,000 | |
| Closed | Kisan Stephen A | $35,700 |
Source: Public Records
Tax History Compared to Growth
Tax History
| Year | Tax Paid | Tax Assessment Tax Assessment Total Assessment is a certain percentage of the fair market value that is determined by local assessors to be the total taxable value of land and additions on the property. | Land | Improvement |
|---|---|---|---|---|
| 2024 | $10,338 | $187,775 | $35,455 | $152,320 |
| 2023 | $8,741 | $147,180 | $38,220 | $108,960 |
| 2022 | $8,708 | $147,180 | $38,220 | $108,960 |
| 2021 | $8,799 | $147,180 | $38,220 | $108,960 |
| 2020 | $8,790 | $140,180 | $36,400 | $103,780 |
| 2019 | $8,534 | $400,500 | $104,000 | $296,500 |
| 2018 | $8,624 | $140,180 | $36,400 | $103,780 |
| 2017 | $8,717 | $135,630 | $34,930 | $100,700 |
| 2016 | $8,169 | $135,630 | $34,930 | $100,700 |
| 2015 | $7,433 | $135,630 | $34,930 | $100,700 |
| 2014 | $7,433 | $123,310 | $31,750 | $91,560 |
Source: Public Records
Map
Nearby Homes
- 0 Tilby Rd
- 9530 Tilby Rd
- 9581 Tilby Rd
- 9912 Lynn Dr
- 7957 Pamela Dr
- 8414 York Rd
- 6451 Glenwillow Dr
- 10821 Gregory Ln
- 10641 Albion Rd
- 11550 York Rd
- 9841 Beechwood Dr
- 7987 Ridge Rd
- 9530 Cove Dr Unit C-25
- 9510 Cove Dr Unit C12
- 11658 York Rd
- 9035 Wallings Rd
- 9901 Beechwood Dr
- 9660 Cove Dr Unit F13
- 11000 W Sprague Rd
- 9630 Cove Dr Unit A-14
- 9364 Chesapeake Dr
- 9352 Chesapeake Dr
- 9370 Chesapeake Dr
- 9346 Chesapeake Dr
- 9212 Roanoke Ct
- 9361 Chesapeake Dr
- 9355 Chesapeake Dr
- 9367 Chesapeake Dr
- 9376 Chesapeake Dr
- 9340 Chesapeake Dr
- 9349 Chesapeake Dr
- 9208 Roanoke Ct
- 9373 Chesapeake Dr
- 9382 Chesapeake Dr
- 9343 Chesapeake Dr
- 9204 Roanoke Ct
- 9385 Chesapeake Dr
- 9337 Chesapeake Dr
- 9207 Roanoke Ct
- 9388 Chesapeake Dr