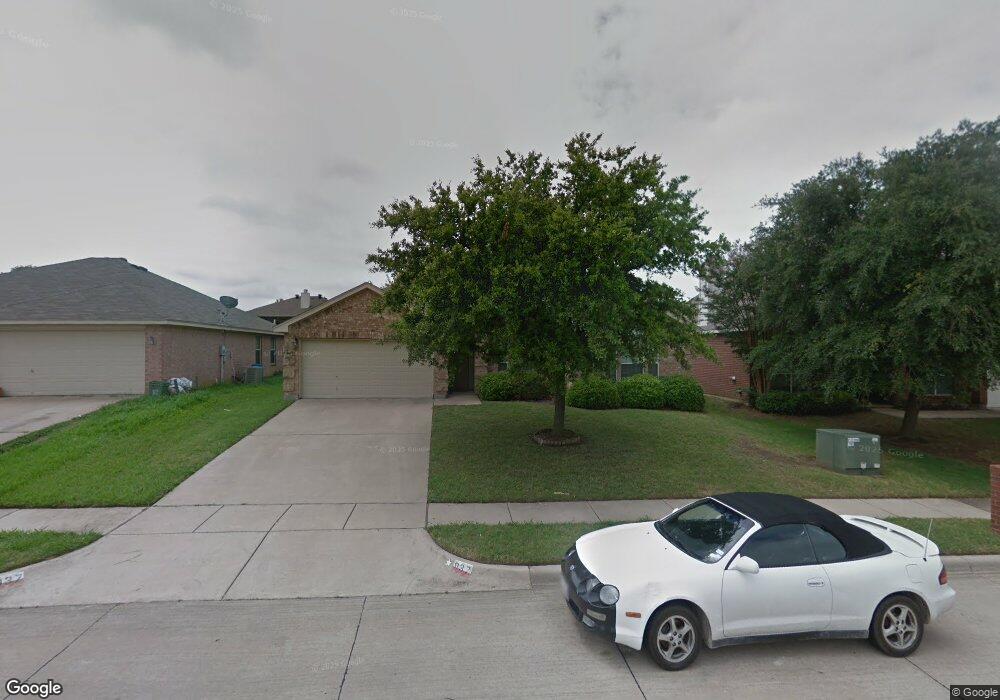
937 Joshua Dr Burleson, TX 76028
Estimated Value: $313,326 - $336,000
4
Beds
2
Baths
1,895
Sq Ft
$172/Sq Ft
Est. Value
About This Home
This home is located at 937 Joshua Dr, Burleson, TX 76028 and is currently estimated at $325,832, approximately $171 per square foot. 937 Joshua Dr is a home located in Johnson County with nearby schools including Frazier Elementary School, Hughes Middle School, and Burleson High School.
Ownership History
Date
Name
Owned For
Owner Type
Purchase Details
Closed on
Dec 7, 2012
Sold by
Foret Charles C and Foret Brandi S
Bought by
Patrick Margaret F
Current Estimated Value
Home Financials for this Owner
Home Financials are based on the most recent Mortgage that was taken out on this home.
Original Mortgage
$139,918
Outstanding Balance
$98,657
Interest Rate
3.75%
Mortgage Type
FHA
Estimated Equity
$227,175
Purchase Details
Closed on
Jan 8, 2010
Sold by
Rose Land & Finance Corp
Bought by
Hobbs Jimmy
Create a Home Valuation Report for This Property
The Home Valuation Report is an in-depth analysis detailing your home's value as well as a comparison with similar homes in the area
Home Values in the Area
Average Home Value in this Area
Purchase History
| Date | Buyer | Sale Price | Title Company |
|---|---|---|---|
| Patrick Margaret F | -- | First American Title Insuran | |
| Hobbs Jimmy | -- | None Available |
Source: Public Records
Mortgage History
| Date | Status | Borrower | Loan Amount |
|---|---|---|---|
| Open | Patrick Margaret F | $139,918 |
Source: Public Records
Tax History Compared to Growth
Tax History
| Year | Tax Paid | Tax Assessment Tax Assessment Total Assessment is a certain percentage of the fair market value that is determined by local assessors to be the total taxable value of land and additions on the property. | Land | Improvement |
|---|---|---|---|---|
| 2025 | $5,247 | $337,271 | $50,000 | $287,271 |
| 2024 | $6,615 | $287,979 | $0 | $0 |
| 2023 | $4,634 | $331,271 | $44,000 | $287,271 |
| 2022 | $5,986 | $271,727 | $44,000 | $227,727 |
| 2021 | $5,627 | $216,363 | $44,000 | $172,363 |
| 2020 | $5,729 | $211,139 | $44,000 | $167,139 |
| 2019 | $5,899 | $211,139 | $44,000 | $167,139 |
| 2018 | $5,363 | $197,695 | $41,000 | $156,695 |
| 2017 | $4,634 | $175,092 | $31,000 | $144,092 |
| 2016 | $4,213 | $154,812 | $31,000 | $123,812 |
| 2015 | $3,562 | $140,053 | $31,000 | $109,053 |
| 2014 | $3,562 | $140,053 | $31,000 | $109,053 |
Source: Public Records
Map
Nearby Homes
- 908 Ryanfield Ct
- 926 Morgan Dr
- 969 Marcia Ln
- 1033 Mckavett Dr
- 931 White Marlin Dr
- 729 Ridgehill Dr
- 944 Brown Crest Rd
- 809 Sierra Cir
- 1117 Marcia Ln
- 900 Pebblecreek Dr
- 832 Pebblecreek Dr
- 621 Daniel Dr
- 905 Hunter Ln
- 725 Snapper Dr
- 708 Creekview Dr
- 612 Jeffdale Dr
- 1116 Brown Crest Rd
- 1029 White Marlin Dr
- 620 Ridgehill Dr
- 904 Brighton Way
- 935 Joshua Dr
- 939 Joshua Dr
- 943 Joshua Dr
- 912 Ryanfield Ct
- 916 Ryanfield Ct
- 938 Joshua Dr
- 920 Ryanfield Ct
- 904 Ryanfield Ct
- 929 Joshua Dr
- 940 Joshua Dr
- 936 Joshua Dr
- 947 Joshua Dr
- 944 Joshua Dr
- 932 Joshua Dr
- 924 Ryanfield Ct
- 925 Joshua Dr
- 900 Ryanfield Ct
- 928 Joshua Dr
- 948 Joshua Dr
- 917 Ryanfield Ct