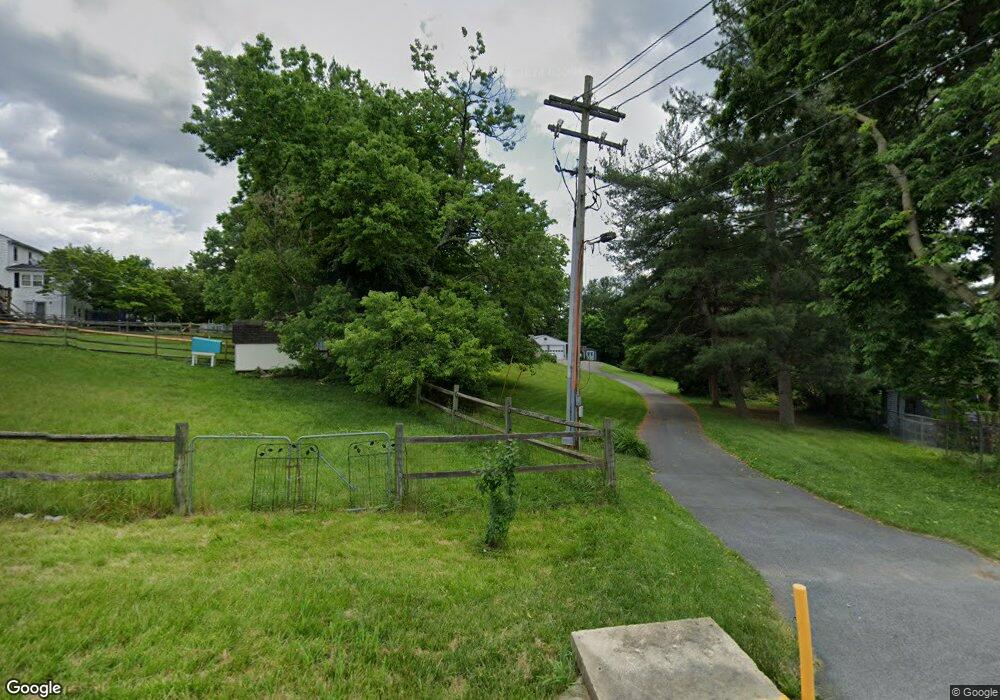
938 N Maple Ave Brunswick, MD 21716
Estimated Value: $425,000 - $587,000
5
Beds
3
Baths
2,823
Sq Ft
$183/Sq Ft
Est. Value
About This Home
This home is located at 938 N Maple Ave, Brunswick, MD 21716 and is currently estimated at $517,450, approximately $183 per square foot. 938 N Maple Ave is a home located in Frederick County with nearby schools including Brunswick Elementary School, Brunswick Middle School, and Brunswick High School.
Ownership History
Date
Name
Owned For
Owner Type
Purchase Details
Closed on
Nov 7, 2008
Sold by
Wohlleban William M and Wohlleban Jennifer P
Bought by
Fitch Jonathan R and Fitch Lauren N
Current Estimated Value
Home Financials for this Owner
Home Financials are based on the most recent Mortgage that was taken out on this home.
Original Mortgage
$288,435
Outstanding Balance
$189,803
Interest Rate
6.13%
Mortgage Type
FHA
Estimated Equity
$327,647
Purchase Details
Closed on
Oct 31, 2008
Sold by
Wohlleban William M and Wohlleban Jennifer P
Bought by
Fitch Jonathan R and Fitch Lauren N
Home Financials for this Owner
Home Financials are based on the most recent Mortgage that was taken out on this home.
Original Mortgage
$288,435
Outstanding Balance
$189,803
Interest Rate
6.13%
Mortgage Type
FHA
Estimated Equity
$327,647
Purchase Details
Closed on
Apr 4, 1996
Sold by
Fleet Finance Inc
Bought by
Wohlleban William M and Wohlleban Jennifer P
Create a Home Valuation Report for This Property
The Home Valuation Report is an in-depth analysis detailing your home's value as well as a comparison with similar homes in the area
Home Values in the Area
Average Home Value in this Area
Purchase History
| Date | Buyer | Sale Price | Title Company |
|---|---|---|---|
| Fitch Jonathan R | $290,000 | -- | |
| Fitch Jonathan R | $290,000 | -- | |
| Wohlleban William M | $62,000 | -- |
Source: Public Records
Mortgage History
| Date | Status | Borrower | Loan Amount |
|---|---|---|---|
| Open | Fitch Jonathan R | $288,435 | |
| Closed | Fitch Jonathan R | $288,435 |
Source: Public Records
Tax History Compared to Growth
Tax History
| Year | Tax Paid | Tax Assessment Tax Assessment Total Assessment is a certain percentage of the fair market value that is determined by local assessors to be the total taxable value of land and additions on the property. | Land | Improvement |
|---|---|---|---|---|
| 2025 | $5,766 | $412,700 | -- | -- |
| 2024 | $5,766 | $382,700 | $120,800 | $261,900 |
| 2023 | $5,325 | $360,133 | $0 | $0 |
| 2022 | $5,070 | $337,567 | $0 | $0 |
| 2021 | $4,597 | $315,000 | $85,400 | $229,600 |
| 2020 | $4,597 | $297,000 | $0 | $0 |
| 2019 | $4,377 | $279,000 | $0 | $0 |
| 2018 | $4,243 | $261,000 | $61,600 | $199,400 |
| 2017 | $4,191 | $261,000 | $0 | $0 |
| 2016 | $4,429 | $257,467 | $0 | $0 |
| 2015 | $4,429 | $255,700 | $0 | $0 |
| 2014 | $4,429 | $255,700 | $0 | $0 |
Source: Public Records
Map
Nearby Homes