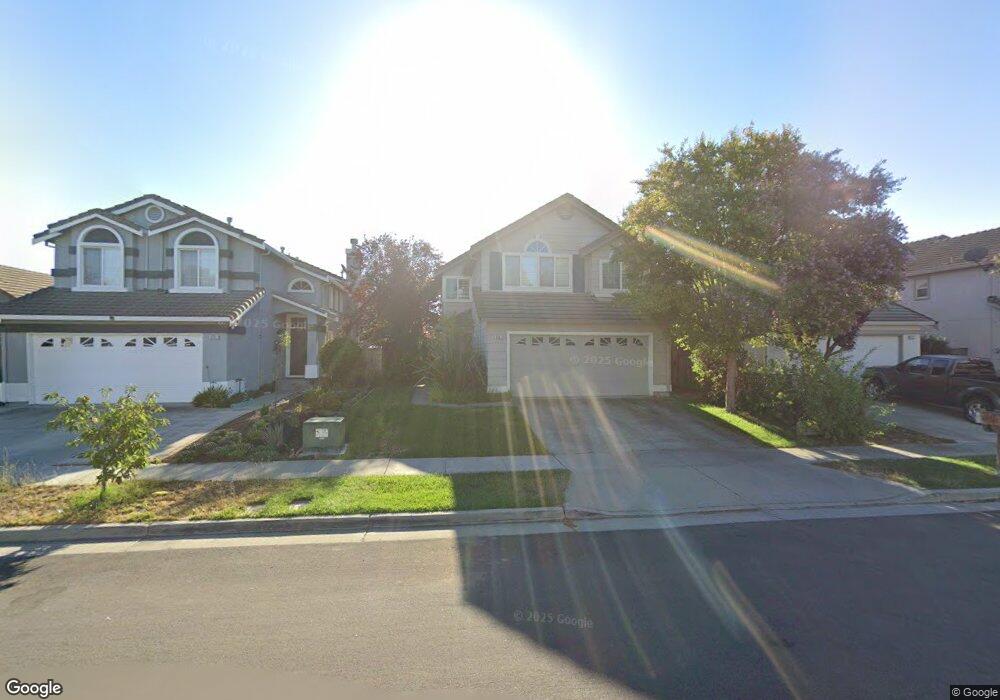
9382 Lariat Dr Gilroy, CA 95020
Las Animas NeighborhoodEstimated Value: $953,780 - $1,081,000
3
Beds
3
Baths
1,689
Sq Ft
$598/Sq Ft
Est. Value
About This Home
This home is located at 9382 Lariat Dr, Gilroy, CA 95020 and is currently estimated at $1,010,445, approximately $598 per square foot. 9382 Lariat Dr is a home located in Santa Clara County with nearby schools including Luigi Aprea Elementary School, Brownell Middle School, and Solorsano Middle School.
Ownership History
Date
Name
Owned For
Owner Type
Purchase Details
Closed on
Jul 21, 2009
Sold by
Landeros Hector and Landeros Gabriela
Bought by
Hart Bill and Hart Lisa
Current Estimated Value
Home Financials for this Owner
Home Financials are based on the most recent Mortgage that was taken out on this home.
Original Mortgage
$368,207
Interest Rate
5.31%
Mortgage Type
FHA
Purchase Details
Closed on
Mar 29, 2000
Sold by
Stevens Dwight S
Bought by
Hess Karl J
Home Financials for this Owner
Home Financials are based on the most recent Mortgage that was taken out on this home.
Original Mortgage
$304,000
Interest Rate
8%
Purchase Details
Closed on
Aug 25, 1997
Sold by
Valley Title Co
Bought by
Stevens Dwight S
Home Financials for this Owner
Home Financials are based on the most recent Mortgage that was taken out on this home.
Original Mortgage
$173,600
Interest Rate
7.43%
Create a Home Valuation Report for This Property
The Home Valuation Report is an in-depth analysis detailing your home's value as well as a comparison with similar homes in the area
Home Values in the Area
Average Home Value in this Area
Purchase History
| Date | Buyer | Sale Price | Title Company |
|---|---|---|---|
| Hart Bill | $375,000 | Chicago Title Company | |
| Hess Karl J | $380,000 | Old Republic Title Company | |
| Stevens Dwight S | $380,000 | Old Republic Title Company | |
| Stevens Dwight S | $231,500 | Golden California Title Co |
Source: Public Records
Mortgage History
| Date | Status | Borrower | Loan Amount |
|---|---|---|---|
| Previous Owner | Hart Bill | $368,207 | |
| Previous Owner | Hess Karl J | $304,000 | |
| Previous Owner | Stevens Dwight S | $173,600 | |
| Closed | Stevens Dwight S | $34,700 | |
| Closed | Hess Karl J | $57,000 |
Source: Public Records
Tax History Compared to Growth
Tax History
| Year | Tax Paid | Tax Assessment Tax Assessment Total Assessment is a certain percentage of the fair market value that is determined by local assessors to be the total taxable value of land and additions on the property. | Land | Improvement |
|---|---|---|---|---|
| 2025 | $5,945 | $484,043 | $193,616 | $290,427 |
| 2024 | $5,945 | $474,553 | $189,820 | $284,733 |
| 2023 | $5,910 | $465,249 | $186,099 | $279,150 |
| 2022 | $5,812 | $456,127 | $182,450 | $273,677 |
| 2021 | $5,786 | $447,184 | $178,873 | $268,311 |
| 2020 | $5,723 | $442,599 | $177,039 | $265,560 |
| 2019 | $5,670 | $433,921 | $173,568 | $260,353 |
| 2018 | $5,296 | $425,414 | $170,165 | $255,249 |
| 2017 | $5,407 | $417,074 | $166,829 | $250,245 |
| 2016 | $5,295 | $408,897 | $163,558 | $245,339 |
| 2015 | $4,997 | $402,756 | $161,102 | $241,654 |
| 2014 | $4,966 | $394,868 | $157,947 | $236,921 |
Source: Public Records
Map
Nearby Homes
- 9632 Cherrywood Ct
- 1080 Sunrise Dr
- 820 Woodcreek Way
- 9850 Bobcat Ct
- 670 Wickham Ct
- 1469 Eagles Nest Ln
- 1486 Swallow Ln
- 1206 Sycamore Ct
- 1469 Goshawk Ct
- 264 Windsong Way
- 1482 Goshawk Ct
- 1180 Day Rd
- 9232 Kestrel Ct
- 8940 Acorn Way
- 1297 Chesbro Way
- 1620 Welburn Ave
- 9135 Desiderio Way
- 119 Farrell Ave
- 103 Farrell Ave
- 111 Farrell Ave