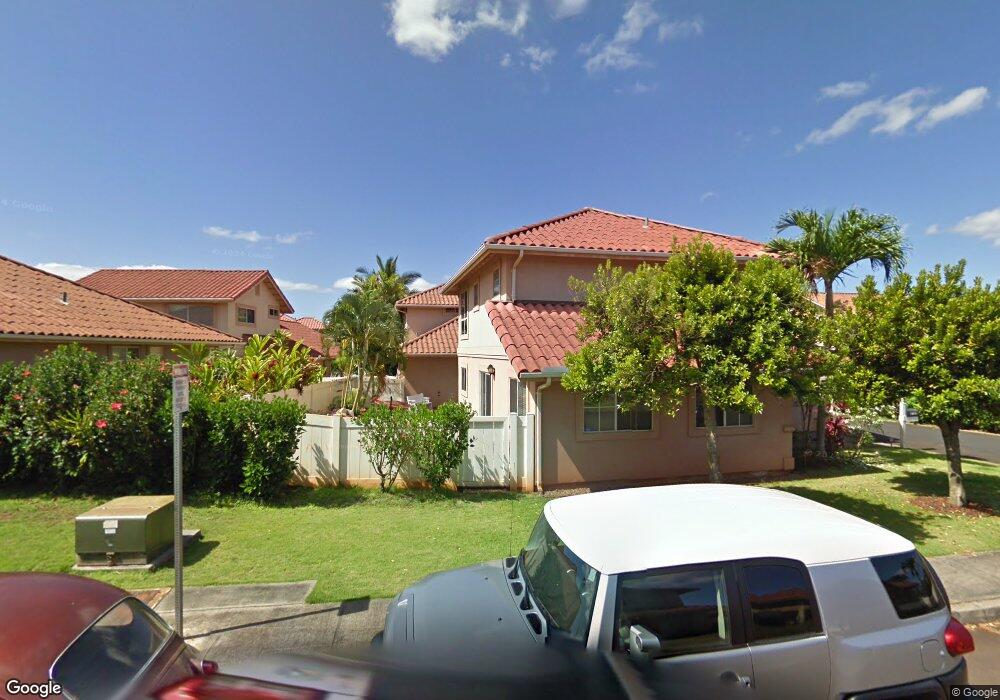
94-203 Kikepa Place Waipahu, HI 96797
Estimated Value: $752,641 - $905,000
2
Beds
2
Baths
917
Sq Ft
$930/Sq Ft
Est. Value
About This Home
This home is located at 94-203 Kikepa Place, Waipahu, HI 96797 and is currently estimated at $852,410, approximately $929 per square foot. 94-203 Kikepa Place is a home located in Honolulu County with nearby schools including Waikele Elementary School, Waipahu Intermediate School, and Waipahu High School.
Ownership History
Date
Name
Owned For
Owner Type
Purchase Details
Closed on
Jan 10, 2018
Sold by
Butler Darryl O Brien
Bought by
Butler Darryl O Brien
Current Estimated Value
Purchase Details
Closed on
Jun 19, 2014
Sold by
Douglas David Scott and Douglas Sung Ja Kim
Bought by
Butler Darryl O Brien
Home Financials for this Owner
Home Financials are based on the most recent Mortgage that was taken out on this home.
Original Mortgage
$410,000
Outstanding Balance
$311,502
Interest Rate
4.17%
Mortgage Type
VA
Estimated Equity
$540,908
Purchase Details
Closed on
Mar 22, 2013
Sold by
Hiroe David Ken
Bought by
Douglas David Scott and Douglas Sung Ja Kim
Home Financials for this Owner
Home Financials are based on the most recent Mortgage that was taken out on this home.
Original Mortgage
$485,000
Interest Rate
3.47%
Mortgage Type
VA
Create a Home Valuation Report for This Property
The Home Valuation Report is an in-depth analysis detailing your home's value as well as a comparison with similar homes in the area
Home Values in the Area
Average Home Value in this Area
Purchase History
| Date | Buyer | Sale Price | Title Company |
|---|---|---|---|
| Butler Darryl O Brien | -- | None Available | |
| Butler Darryl O Brien | -- | None Available | |
| Butler Darryl O Brien | $515,000 | Premier Title | |
| Butler Darryl O Brien | $515,000 | Premier Title | |
| Douglas David Scott | $485,000 | Fam | |
| Douglas David Scott | $485,000 | Fam |
Source: Public Records
Mortgage History
| Date | Status | Borrower | Loan Amount |
|---|---|---|---|
| Open | Butler Darryl O Brien | $410,000 | |
| Closed | Butler Darryl O Brien | $410,000 | |
| Previous Owner | Douglas David Scott | $485,000 |
Source: Public Records
Tax History Compared to Growth
Tax History
| Year | Tax Paid | Tax Assessment Tax Assessment Total Assessment is a certain percentage of the fair market value that is determined by local assessors to be the total taxable value of land and additions on the property. | Land | Improvement |
|---|---|---|---|---|
| 2025 | $2,847 | $823,700 | $628,700 | $195,000 |
| 2024 | $2,847 | $813,400 | $628,700 | $184,700 |
| 2023 | $2,516 | $845,400 | $628,700 | $216,700 |
| 2022 | $2,516 | $718,900 | $489,000 | $229,900 |
| 2021 | $2,270 | $648,600 | $461,000 | $187,600 |
| 2020 | $2,282 | $652,100 | $489,000 | $163,100 |
| 2019 | $2,223 | $635,000 | $454,000 | $181,000 |
| 2018 | $2,142 | $611,900 | $405,100 | $206,800 |
| 2017 | $1,889 | $539,600 | $380,700 | $158,900 |
| 2016 | $1,857 | $530,500 | $373,700 | $156,800 |
| 2015 | $1,874 | $535,500 | $363,200 | $172,300 |
| 2014 | $1,301 | $491,000 | $342,300 | $148,700 |
Source: Public Records
Map
Nearby Homes
- 94-1066 Kikepa St Unit 193
- 94-211 Loku Place Unit B122
- 94-1010 Maiau St Unit 144
- 94-547 Lumiauau St
- 94-209 Paioa Place Unit L205
- 94-203 Paioa Place Unit P201
- 94-213 Paioa Place Unit J202
- 94-690 Lumiauau St Unit TT5
- 94-672 Lumiauau St Unit G2
- 94-686 Lumiauau St Unit UU204
- 94-527 Lumiaina St Unit E202
- 94-201 Lumiaina Place Unit E202
- 94-203 Lumiaina Place Unit F201
- 94-644 Lumiaina St Unit BB203
- 94-608 Lumiaina St Unit S201
- 94-624 Lumiaina St Unit J101
- 94-600 Lumiaina St Unit W202
- 94-746 Lumiauau St Unit CC2
- 94-519 Lumiaina St Unit J204
- 94-1211 Heahea St
- 94-203 Kikepa Place Unit 47
- 94-206 Kikepa Place
- 94-210 Kikepa Place Unit 39
- 94-213 Kikepa Place
- 94-200B Huewai Place Unit 68
- 94-200B Huewai Place Unit 200B
- 94-208 Huewai Place
- 94-218 Kikepa Place Unit 34
- 94 Kikepa Place
- 94-216 Kikepa Place Unit A37
- 94-216 Kikepa Place
- 94-216 Kikepa Place Unit B
- 94-216 Kikepa Place Unit C
- 94-216A Kikepa Place Unit 37
- 94-216 Huewai Place Unit 57
- 94-209 Huewai Place Unit 79
- 94-1016 Kikepa St Unit 21
- 94-201 Huewai Place Unit 74
- 94-205 Huewai Place Unit A
- 94-205 Huewai Place Unit C78