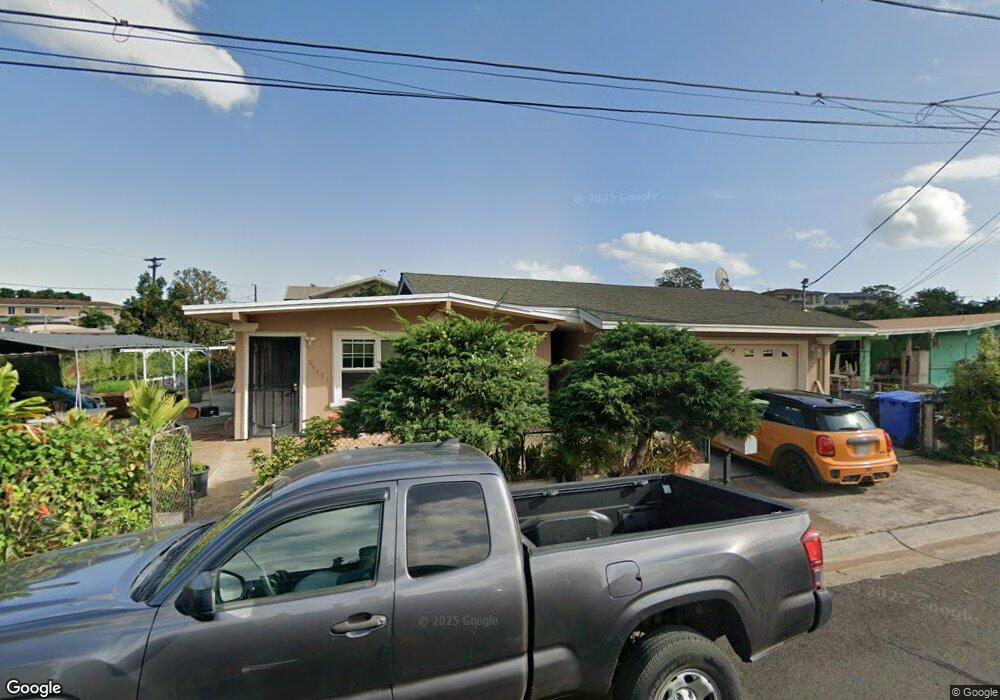
94-473 Kalukalu St Waipahu, HI 96797
Estimated Value: $912,000 - $1,044,558
5
Beds
4
Baths
2,106
Sq Ft
$466/Sq Ft
Est. Value
About This Home
This home is located at 94-473 Kalukalu St, Waipahu, HI 96797 and is currently estimated at $981,890, approximately $466 per square foot. 94-473 Kalukalu St is a home located in Honolulu County with nearby schools including Waipahu Elementary School, Waipahu Intermediate School, and Waipahu High School.
Ownership History
Date
Name
Owned For
Owner Type
Purchase Details
Closed on
May 18, 1999
Sold by
Aquino Asuncion Llacuna
Bought by
Fagaragan Gene Palalay and Fagaragan Gina Macalma
Current Estimated Value
Home Financials for this Owner
Home Financials are based on the most recent Mortgage that was taken out on this home.
Original Mortgage
$206,247
Outstanding Balance
$52,761
Interest Rate
6.92%
Mortgage Type
FHA
Estimated Equity
$929,129
Purchase Details
Closed on
Jul 29, 1998
Sold by
Aquino Valerio Llacuna and Aquino Azuncion Llacuna
Bought by
Aquino Asuncion Llacuna
Purchase Details
Closed on
Jun 13, 1996
Sold by
Saito Ann Chiyoko and Imaoka Arnold Kameo
Bought by
Aquino Valerio Llacuna and Aquino Asuncion Llacuna
Home Financials for this Owner
Home Financials are based on the most recent Mortgage that was taken out on this home.
Original Mortgage
$171,500
Interest Rate
8.25%
Create a Home Valuation Report for This Property
The Home Valuation Report is an in-depth analysis detailing your home's value as well as a comparison with similar homes in the area
Home Values in the Area
Average Home Value in this Area
Purchase History
| Date | Buyer | Sale Price | Title Company |
|---|---|---|---|
| Fagaragan Gene Palalay | $209,000 | -- | |
| Aquino Asuncion Llacuna | -- | -- | |
| Aquino Valerio Llacuna | $245,000 | -- |
Source: Public Records
Mortgage History
| Date | Status | Borrower | Loan Amount |
|---|---|---|---|
| Open | Fagaragan Gene Palalay | $206,247 | |
| Previous Owner | Aquino Valerio Llacuna | $171,500 |
Source: Public Records
Tax History Compared to Growth
Tax History
| Year | Tax Paid | Tax Assessment Tax Assessment Total Assessment is a certain percentage of the fair market value that is determined by local assessors to be the total taxable value of land and additions on the property. | Land | Improvement |
|---|---|---|---|---|
| 2025 | $4,801 | $992,900 | $757,200 | $235,700 |
| 2024 | $4,801 | $1,070,300 | $725,700 | $344,600 |
| 2023 | $4,207 | $1,018,200 | $715,200 | $303,000 |
| 2022 | $3,122 | $891,900 | $641,500 | $250,400 |
| 2021 | $2,885 | $824,300 | $578,400 | $245,900 |
| 2020 | $2,730 | $779,900 | $500,100 | $279,800 |
| 2019 | $2,711 | $774,600 | $500,100 | $274,500 |
| 2018 | $2,546 | $727,500 | $459,300 | $268,200 |
| 2017 | $2,420 | $691,500 | $387,900 | $303,600 |
| 2016 | $2,355 | $672,900 | $377,700 | $295,200 |
| 2015 | $2,053 | $586,500 | $357,200 | $229,300 |
| 2014 | -- | $554,500 | $336,800 | $217,700 |
Source: Public Records
Map
Nearby Homes
- 94-555 Awamoi St
- 94-536 Koaleo St Unit A
- 94-249 Waikele Rd Unit B110
- 94-249 Waikele Rd Unit B214
- 94-249 Waikele Rd Unit A304
- 94-249 Waikele Rd Unit A306
- 94-246 Aniani Place
- 94-319 Honowai St
- 94-238 Aniani Place
- 94-334 Loaa Place
- 94-1050 Hahana St
- 94-811 Kaaholo St
- 94-805 Kaaholo St
- 94-245 Leowahine St Unit 118
- 94-245 Leowahine St Unit 239
- 94-245 Leowahine St Unit 1015
- 94-245 Leowahine St Unit 2003
- 94-245 Leowahine St Unit 3002
- 94-510 Lumiaina St Unit J202
- 94-510 Lumiaina St Unit N201
- 94-467 Kalukalu St
- 94-408 Ikepono St
- 94-479 Kalukalu St
- 94-490 Apowale St
- 94-482 Apowale St
- 94-461 Kalukalu St
- 94-468 Kalukalu St
- 94-474 Kalukalu St
- 94-474 Apowale St
- 94-478 Kalukalu St
- 94-422 Ikepono St
- 94-460 Kalukalu St
- 94455 Kalukalu St
- 94-455 Kalukalu St
- 94-468 Apowale St
- 94-409 Ikepono St
- 94-415 Ikepono St
- 94-405 Ikepono St
- 94-452 Kalukalu St
- 94-428 Ikepono St