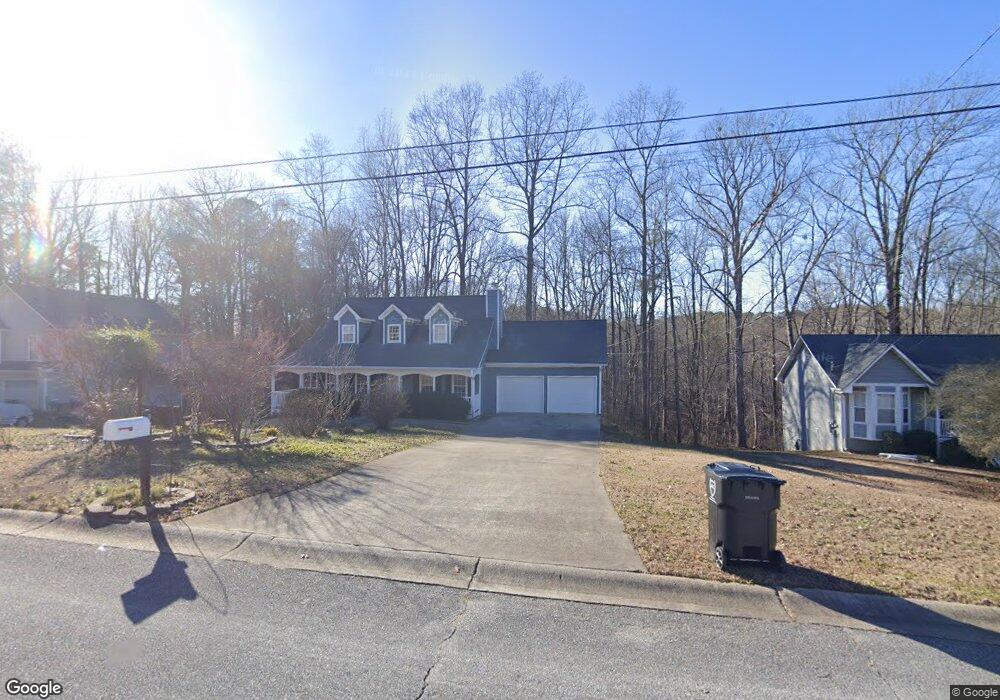
94 Cliff Ct Villa Rica, GA 30180
Estimated Value: $288,000 - $313,000
3
Beds
2
Baths
1,382
Sq Ft
$221/Sq Ft
Est. Value
About This Home
This home is located at 94 Cliff Ct, Villa Rica, GA 30180 and is currently estimated at $305,030, approximately $220 per square foot. 94 Cliff Ct is a home located in Carroll County with nearby schools including Glanton-Hindsman Elementary School, Villa Rica Middle School, and Villa Rica High School.
Ownership History
Date
Name
Owned For
Owner Type
Purchase Details
Closed on
Oct 19, 2021
Sold by
Path Acquisitions Trs Llc
Bought by
Pagaya Smartresi F1 Fund Property Owner
Current Estimated Value
Purchase Details
Closed on
Oct 14, 2021
Sold by
Llf Accomodations Llc
Bought by
Path Acquisitions Trs Llc
Purchase Details
Closed on
Oct 8, 2021
Sold by
Sealock Elizabeth Renee
Bought by
Brookshire Capital Llc
Purchase Details
Closed on
Oct 4, 2007
Sold by
Beatty Stephen M
Bought by
Sealock Tracy Dwayne and Sealock Elizabeth Renee
Purchase Details
Closed on
Nov 7, 2000
Sold by
Beatty Kaci N
Bought by
Beatty Stephen M
Purchase Details
Closed on
Apr 1, 1998
Sold by
Progressive Enterpri
Bought by
Beatty Stephen M and Beatty K
Purchase Details
Closed on
Jan 1, 1997
Sold by
Harrison David and Harrison Alv
Bought by
Harrison David and Harrison Alv
Purchase Details
Closed on
Jul 2, 1996
Bought by
Harrison David and Harrison Alv
Create a Home Valuation Report for This Property
The Home Valuation Report is an in-depth analysis detailing your home's value as well as a comparison with similar homes in the area
Home Values in the Area
Average Home Value in this Area
Purchase History
| Date | Buyer | Sale Price | Title Company |
|---|---|---|---|
| Pagaya Smartresi F1 Fund Property Owner | $253,152 | -- | |
| Path Acquisitions Trs Llc | $250,000 | -- | |
| Brookshire Capital Llc | $210,000 | -- | |
| Sealock Tracy Dwayne | $134,618 | -- | |
| Beatty Stephen M | -- | -- | |
| Beatty Stephen M | $99,900 | -- | |
| Progressive Enterpri | $77,300 | -- | |
| Harrison David | -- | -- | |
| Harrison David | $153,600 | -- |
Source: Public Records
Tax History Compared to Growth
Tax History
| Year | Tax Paid | Tax Assessment Tax Assessment Total Assessment is a certain percentage of the fair market value that is determined by local assessors to be the total taxable value of land and additions on the property. | Land | Improvement |
|---|---|---|---|---|
| 2024 | $3,069 | $135,642 | $8,000 | $127,642 |
| 2023 | $3,069 | $124,046 | $8,000 | $116,046 |
| 2022 | $2,537 | $101,167 | $8,000 | $93,167 |
| 2021 | $1,660 | $64,757 | $8,000 | $56,757 |
| 2020 | $1,511 | $58,862 | $8,000 | $50,862 |
| 2019 | $1,442 | $55,730 | $8,000 | $47,730 |
| 2018 | $1,327 | $50,543 | $8,000 | $42,543 |
| 2017 | $1,331 | $50,543 | $8,000 | $42,543 |
| 2016 | $1,332 | $50,543 | $8,000 | $42,543 |
| 2015 | $1,292 | $46,198 | $8,000 | $38,198 |
| 2014 | $1,297 | $46,198 | $8,000 | $38,198 |
Source: Public Records
Map
Nearby Homes
- 84 Ledbetter Rd
- 114 Clay Ct
- 232 Harlan Heights Rd
- 141 Ledbetter Rd
- 104 Dalton Dr
- 1052 Harlan Lane Rd
- 37 Tapley Rd
- 1180 Harlan Lane Rd
- 101 Cedars Glen Cir
- 213 Cornell Ct
- 100 Cedars Glen Cir
- 17 Cedars Glen Place
- 178 Cedars Glen Cir
- 337 Cranmore Place
- 227 Cedars Glen Cir
- 504 Iris Way
- 436 Abbey Place
- 281 Cedars Glen Cir
- 104 Cliff Ct
- 84 Cliff Ct
- 0 Cliff Ct Unit 7462808
- 0 Cliff Ct Unit 7456116
- 0 Cliff Ct Unit 7400634
- 0 Cliff Ct Unit 3189124
- 0 Cliff Ct Unit 8575496
- 0 Cliff Ct Unit 7623441
- 0 Cliff Ct Unit 7558978
- 0 Cliff Ct Unit 8760232
- 0 Cliff Ct
- 74 Cliff Ct
- 112 Cliff Ct
- 95 Cliff Ct
- 85 Cliff Ct
- 107 Cliff Ct
- 64 Cliff Ct
- 75 Cliff Ct
- 120 Cliff Ct
- 56 Cliff Ct