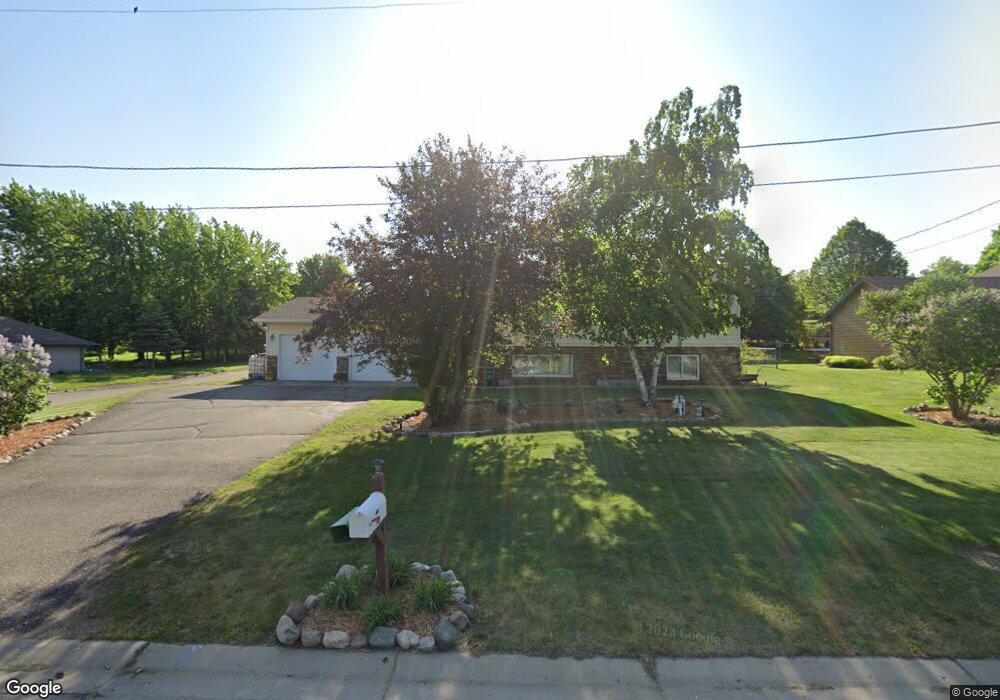
940 4th St Holdingford, MN 56340
Estimated Value: $295,000 - $337,000
5
Beds
2
Baths
1,048
Sq Ft
$296/Sq Ft
Est. Value
About This Home
This home is located at 940 4th St, Holdingford, MN 56340 and is currently estimated at $310,412, approximately $296 per square foot. 940 4th St is a home located in Stearns County with nearby schools including Holdingford Elementary School and Holdingford High School.
Ownership History
Date
Name
Owned For
Owner Type
Purchase Details
Closed on
Jun 20, 2025
Sold by
Loehning Zachary and Loehning Brittany
Bought by
Vanheel Nicole and Vanheel Austin
Current Estimated Value
Home Financials for this Owner
Home Financials are based on the most recent Mortgage that was taken out on this home.
Original Mortgage
$248,000
Outstanding Balance
$247,370
Interest Rate
6.86%
Mortgage Type
New Conventional
Estimated Equity
$63,042
Purchase Details
Closed on
Feb 27, 2019
Sold by
Erickson Matthew D
Bought by
Loehning Brittany and Loehning Zachary
Purchase Details
Closed on
Dec 23, 2010
Sold by
Wasner Bradley S and Wasner Laura M
Bought by
Erickson Matthew D
Purchase Details
Closed on
Oct 31, 2003
Sold by
Gerads Danny
Bought by
Wasner Bradley
Purchase Details
Closed on
Jun 12, 1996
Sold by
Hommerding
Bought by
Gerads
Purchase Details
Closed on
May 2, 1990
Sold by
Wentland
Bought by
Knapp Tillman
Create a Home Valuation Report for This Property
The Home Valuation Report is an in-depth analysis detailing your home's value as well as a comparison with similar homes in the area
Home Values in the Area
Average Home Value in this Area
Purchase History
| Date | Buyer | Sale Price | Title Company |
|---|---|---|---|
| Vanheel Nicole | $310,000 | -- | |
| Vanheel Nicole L | $310,000 | Key Title & Closing Services L | |
| Loehning Brittany | $189,800 | -- | |
| Erickson Matthew D | $166,000 | -- | |
| Wasner Bradley | $138,000 | -- | |
| Gerads | $85,000 | -- | |
| Knapp Tillman | $5,000 | -- |
Source: Public Records
Mortgage History
| Date | Status | Borrower | Loan Amount |
|---|---|---|---|
| Open | Vanheel Nicole L | $248,000 | |
| Closed | Vanheel Nicole | $307,000 |
Source: Public Records
Tax History Compared to Growth
Tax History
| Year | Tax Paid | Tax Assessment Tax Assessment Total Assessment is a certain percentage of the fair market value that is determined by local assessors to be the total taxable value of land and additions on the property. | Land | Improvement |
|---|---|---|---|---|
| 2025 | $2,866 | $270,500 | $21,200 | $249,300 |
| 2024 | $2,834 | $270,400 | $21,200 | $249,200 |
| 2023 | $2,840 | $261,100 | $21,200 | $239,900 |
| 2022 | $2,446 | $191,600 | $17,500 | $174,100 |
| 2021 | $2,514 | $191,600 | $17,500 | $174,100 |
| 2020 | $2,694 | $192,300 | $18,400 | $173,900 |
| 2019 | $2,504 | $179,000 | $18,400 | $160,600 |
| 2018 | $2,266 | $156,800 | $18,400 | $138,400 |
| 2017 | $2,308 | $144,700 | $18,400 | $126,300 |
| 2016 | $2,342 | $0 | $0 | $0 |
| 2015 | $2,302 | $0 | $0 | $0 |
| 2014 | -- | $0 | $0 | $0 |
Source: Public Records
Map
Nearby Homes
- 641 2nd St
- 521 Main St
- 224 Spring St
- 121 Main St
- TBD County Road 3
- XX1 County Road 3
- XX3 County Road 3
- XX4 County Road 3
- XX2 County Road 3
- 42720 County Road 3
- 19372 Two Rivers Rd
- 19364 Two Rivers Rd
- 37143 185th Ave
- 19328 Red Oak Cir
- 44103 State Highway 238
- 11688 40th St
- 314 Martin St
- 34740 County Road 9
- 24446 County Road 153
- 44015 100th Ave