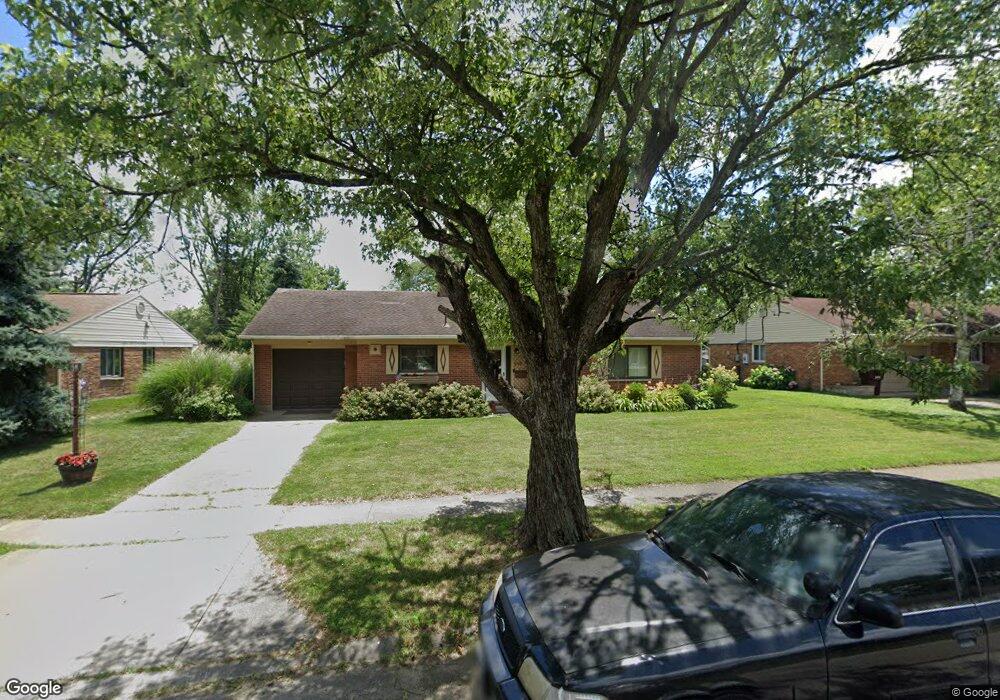
940 Renwood Dr Dayton, OH 45429
Estimated Value: $204,000 - $224,000
3
Beds
1
Bath
1,164
Sq Ft
$184/Sq Ft
Est. Value
About This Home
This home is located at 940 Renwood Dr, Dayton, OH 45429 and is currently estimated at $213,952, approximately $183 per square foot. 940 Renwood Dr is a home located in Montgomery County with nearby schools including Oakview Elementary School, Van Buren Middle School, and Kettering Fairmont High School.
Ownership History
Date
Name
Owned For
Owner Type
Purchase Details
Closed on
Jan 10, 2022
Sold by
Long-Whitmore Peggy L and Long-Whitmore David L
Bought by
Ricketts Jeffrey and Ricketts Kelly
Current Estimated Value
Home Financials for this Owner
Home Financials are based on the most recent Mortgage that was taken out on this home.
Original Mortgage
$117,645
Outstanding Balance
$108,425
Interest Rate
3.11%
Mortgage Type
VA
Estimated Equity
$105,527
Purchase Details
Closed on
Dec 14, 2017
Sold by
Dcwi 77 Llc
Bought by
Long Whitmore Peggy
Home Financials for this Owner
Home Financials are based on the most recent Mortgage that was taken out on this home.
Original Mortgage
$86,250
Interest Rate
3.9%
Mortgage Type
New Conventional
Purchase Details
Closed on
Nov 16, 2004
Sold by
Wright Donald C and Wright Gayle
Bought by
Dcwi-77 Llc
Create a Home Valuation Report for This Property
The Home Valuation Report is an in-depth analysis detailing your home's value as well as a comparison with similar homes in the area
Home Values in the Area
Average Home Value in this Area
Purchase History
| Date | Buyer | Sale Price | Title Company |
|---|---|---|---|
| Ricketts Jeffrey | -- | Landmark Title | |
| Long Whitmore Peggy | $115,000 | Landmark Title Agency South | |
| Dcwi-77 Llc | -- | None Available |
Source: Public Records
Mortgage History
| Date | Status | Borrower | Loan Amount |
|---|---|---|---|
| Open | Ricketts Jeffrey | $117,645 | |
| Previous Owner | Long Whitmore Peggy | $86,250 |
Source: Public Records
Tax History Compared to Growth
Tax History
| Year | Tax Paid | Tax Assessment Tax Assessment Total Assessment is a certain percentage of the fair market value that is determined by local assessors to be the total taxable value of land and additions on the property. | Land | Improvement |
|---|---|---|---|---|
| 2024 | $3,430 | $53,440 | $13,900 | $39,540 |
| 2023 | $3,430 | $53,440 | $13,900 | $39,540 |
| 2022 | $3,271 | $40,260 | $10,450 | $29,810 |
| 2021 | $3,034 | $40,260 | $10,450 | $29,810 |
| 2020 | $3,043 | $40,260 | $10,450 | $29,810 |
| 2019 | $2,919 | $34,120 | $9,510 | $24,610 |
| 2018 | $2,934 | $34,120 | $9,510 | $24,610 |
| 2017 | $2,713 | $34,120 | $9,510 | $24,610 |
| 2016 | $2,586 | $30,530 | $9,510 | $21,020 |
| 2015 | $2,476 | $30,530 | $9,510 | $21,020 |
| 2014 | $2,476 | $30,530 | $9,510 | $21,020 |
| 2012 | -- | $29,860 | $9,500 | $20,360 |
Source: Public Records
Map
Nearby Homes
- 959 Kimberly Dr
- 1013 Swango Dr
- 1040 Kenosha Rd
- 1105 Greenridge Dr
- 1008 Rio Ln
- 3822 Milford Dr
- 3872 Maryknoll Dr
- 791 Willowdale Ave
- 804 Lovetta Dr
- 1033 Carlo Dr
- 4259 Maxlin Rd
- 855 Brookfield Rd
- 1328 Willowdale Ave
- 604 Schuyler Dr
- 645 Brookfield Rd
- 4244 Flowerdale Ave
- 3725 Claybourne Rd
- 4307 Meadowcroft Rd
- 4640 Marshall Rd
- 856 Timberlake Ct
- 948 Renwood Dr
- 932 Renwood Dr
- 955 Kimberly Dr
- 956 Renwood Dr
- 963 Kimberly Dr
- 939 Renwood Dr
- 924 Renwood Dr
- 945 Renwood Dr
- 933 Renwood Dr
- 4058 Vinita Dr
- 951 Renwood Dr
- 4066 Vinita Dr
- 927 Renwood Dr
- 962 Renwood Dr
- 921 Renwood Dr
- 957 Renwood Dr
- 924 E Stroop Rd
- 958 Kimberly Dr
- 920 E Stroop Rd
- 971 Kimberly Dr