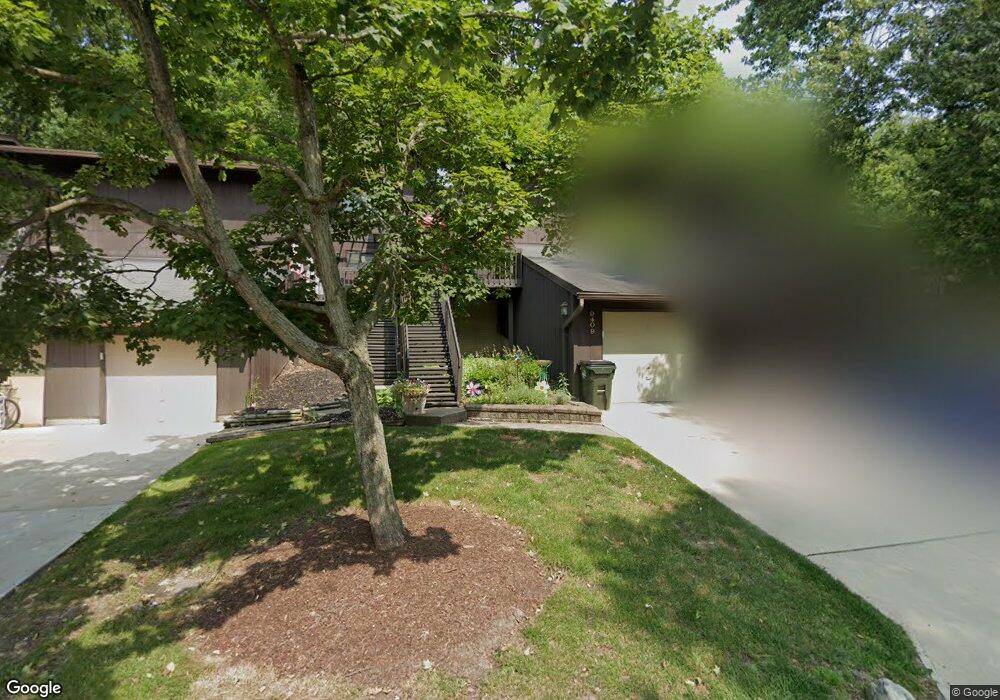
9409 Bassett Ln North Royalton, OH 44133
Estimated Value: $186,000 - $237,000
3
Beds
2
Baths
1,488
Sq Ft
$142/Sq Ft
Est. Value
About This Home
This home is located at 9409 Bassett Ln, North Royalton, OH 44133 and is currently estimated at $211,659, approximately $142 per square foot. 9409 Bassett Ln is a home located in Cuyahoga County with nearby schools including North Royalton Middle School, North Royalton High School, and Saint Albert the Great Roman Catholic School.
Ownership History
Date
Name
Owned For
Owner Type
Purchase Details
Closed on
Jun 3, 2023
Sold by
Kathleen P Price Living Trust
Bought by
Loshak Andre and Loshak Kaitlyn
Current Estimated Value
Home Financials for this Owner
Home Financials are based on the most recent Mortgage that was taken out on this home.
Original Mortgage
$128,000
Outstanding Balance
$124,577
Interest Rate
6.39%
Mortgage Type
Construction
Estimated Equity
$87,082
Purchase Details
Closed on
Feb 23, 2020
Sold by
Price Kathleen P
Bought by
Price Kathleen P and Kathleen P Price Living Trust
Purchase Details
Closed on
May 13, 1994
Sold by
Price William H
Bought by
Price Kathleen P
Purchase Details
Closed on
Apr 15, 1991
Sold by
Shine Edward P
Bought by
Price William H
Purchase Details
Closed on
Jul 26, 1985
Sold by
Hopp John M
Bought by
Shine Edward P
Purchase Details
Closed on
Aug 19, 1981
Sold by
Hopp John M and K A
Bought by
Hopp John M
Purchase Details
Closed on
Jan 1, 1980
Bought by
Hopp John M and K A
Create a Home Valuation Report for This Property
The Home Valuation Report is an in-depth analysis detailing your home's value as well as a comparison with similar homes in the area
Home Values in the Area
Average Home Value in this Area
Purchase History
| Date | Buyer | Sale Price | Title Company |
|---|---|---|---|
| Loshak Andre | $160,000 | Common Law Title | |
| Price Kathleen P | -- | None Available | |
| Price Kathleen P | -- | -- | |
| Price William H | $79,000 | -- | |
| Shine Edward P | $68,000 | -- | |
| Hopp John M | -- | -- | |
| Hopp John M | -- | -- |
Source: Public Records
Mortgage History
| Date | Status | Borrower | Loan Amount |
|---|---|---|---|
| Open | Loshak Andre | $128,000 |
Source: Public Records
Tax History Compared to Growth
Tax History
| Year | Tax Paid | Tax Assessment Tax Assessment Total Assessment is a certain percentage of the fair market value that is determined by local assessors to be the total taxable value of land and additions on the property. | Land | Improvement |
|---|---|---|---|---|
| 2024 | $3,325 | $56,000 | $6,545 | $49,455 |
| 2023 | $3,079 | $48,620 | $4,870 | $43,750 |
| 2022 | $3,058 | $48,620 | $4,870 | $43,750 |
| 2021 | $3,091 | $48,620 | $4,870 | $43,750 |
| 2020 | $2,463 | $36,820 | $3,680 | $33,150 |
| 2019 | $2,391 | $105,200 | $10,500 | $94,700 |
| 2018 | $2,227 | $36,820 | $3,680 | $33,150 |
| 2017 | $2,174 | $31,640 | $3,150 | $28,490 |
| 2016 | $2,037 | $31,640 | $3,150 | $28,490 |
| 2015 | $2,567 | $31,640 | $3,150 | $28,490 |
| 2014 | $2,567 | $39,560 | $3,960 | $35,600 |
Source: Public Records
Map
Nearby Homes
- 11550 York Rd
- 9035 Wallings Rd
- 9530 Cove Dr Unit C-25
- 9510 Cove Dr Unit C12
- 9611 Sunrise Blvd Unit K2
- 9660 Cove Dr Unit F13
- 9710 Cove Dr Unit 23G
- 9800 Cove Dr Unit H2
- 9761 Sunrise Blvd
- 10342 Independence Dr Unit 21B
- 10364 Independence Dr Unit 19c
- 9821 Sunrise Blvd Unit o1
- 10560 Independence Dr Unit 25A
- 11445 Harbour Light Dr
- 12701 Gordon St
- 12906 Cartwright Pkwy
- 13000 Cartwright Pkwy
- 7554 Margaret Dr
- 7595 Margaret Dr
- 7545 Margaret Dr
- 9405 Bassett Ln Unit 406
- 9413 Bassett Ln Unit 404
- 9421 Bassett Ln Unit 402
- 9425 Bassett Ln Unit 401
- 9417 Bassett Ln
- 9424 Bassett Ln Unit 420
- 9408 Bassett Ln
- 9404 Bassett Ln Unit 415
- 9412 Bassett Ln Unit 417
- 9416 Bassett Ln Unit 418
- 9420 Bassett Ln Unit 419
- 9393 Bassett Ln Unit 408
- 9389 Bassett Ln
- 9385 Bassett Ln
- 9397 Bassett Ln
- 9385 Bassett Ln Unit 410
- 9389 Bassett Ln Unit 409
- 9386 Bassett Ln Unit 411
- 9390 Bassett Ln Unit 412
- 9398 Bassett Ln Unit 414