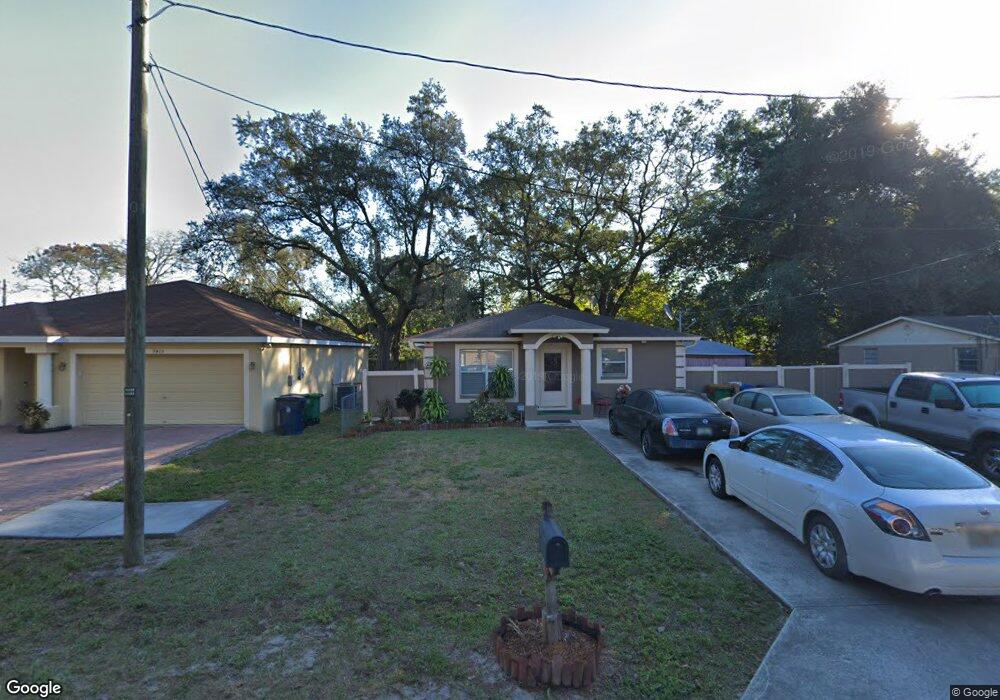
9411 N 15th St Tampa, FL 33612
North Tampa NeighborhoodEstimated Value: $180,000 - $298,690
3
Beds
2
Baths
1,200
Sq Ft
$220/Sq Ft
Est. Value
About This Home
This home is located at 9411 N 15th St, Tampa, FL 33612 and is currently estimated at $263,423, approximately $219 per square foot. 9411 N 15th St is a home located in Hillsborough County with nearby schools including DR Carter G Woodson K-8 School, Wharton High School, and New Springs Schools.
Ownership History
Date
Name
Owned For
Owner Type
Purchase Details
Closed on
Oct 1, 2008
Sold by
Henderson Telicia and Henderson Norma
Bought by
Henderson Norma
Current Estimated Value
Home Financials for this Owner
Home Financials are based on the most recent Mortgage that was taken out on this home.
Original Mortgage
$105,000
Outstanding Balance
$63,954
Interest Rate
4.75%
Mortgage Type
New Conventional
Estimated Equity
$199,469
Purchase Details
Closed on
Jan 14, 2006
Sold by
Henderson Telicia and Henderson Norma
Bought by
Henderson Norma
Purchase Details
Closed on
Oct 3, 1998
Sold by
Rose Shrenk Tr
Bought by
Henderson Norma and Henderson Telicia
Home Financials for this Owner
Home Financials are based on the most recent Mortgage that was taken out on this home.
Original Mortgage
$63,175
Interest Rate
6.96%
Mortgage Type
New Conventional
Purchase Details
Closed on
Apr 13, 1998
Sold by
Yeatts Joseph B and Yeatts Darlene
Bought by
Shrenk Rose
Create a Home Valuation Report for This Property
The Home Valuation Report is an in-depth analysis detailing your home's value as well as a comparison with similar homes in the area
Home Values in the Area
Average Home Value in this Area
Purchase History
| Date | Buyer | Sale Price | Title Company |
|---|---|---|---|
| Henderson Norma | -- | Members Title Agency Llc | |
| Henderson Norma | -- | None Available | |
| Henderson Norma | $66,500 | -- | |
| Shrenk Rose | $4,000 | -- |
Source: Public Records
Mortgage History
| Date | Status | Borrower | Loan Amount |
|---|---|---|---|
| Open | Henderson Norma | $105,000 | |
| Previous Owner | Shrenk Rose | $76,500 | |
| Previous Owner | Shrenk Rose | $63,175 |
Source: Public Records
Tax History Compared to Growth
Tax History
| Year | Tax Paid | Tax Assessment Tax Assessment Total Assessment is a certain percentage of the fair market value that is determined by local assessors to be the total taxable value of land and additions on the property. | Land | Improvement |
|---|---|---|---|---|
| 2024 | $652 | $63,167 | -- | -- |
| 2023 | $646 | $61,327 | $0 | $0 |
| 2022 | $640 | $59,541 | $0 | $0 |
| 2021 | $643 | $57,807 | $0 | $0 |
| 2020 | $639 | $57,009 | $0 | $0 |
| 2019 | $629 | $55,727 | $0 | $0 |
| 2018 | $626 | $54,688 | $0 | $0 |
| 2017 | $619 | $77,240 | $0 | $0 |
| 2016 | $605 | $52,461 | $0 | $0 |
| 2015 | $585 | $52,096 | $0 | $0 |
| 2014 | $1,003 | $43,494 | $0 | $0 |
| 2013 | -- | $39,540 | $0 | $0 |
Source: Public Records
Map
Nearby Homes
- 1502 E Sewaha St
- 9502 Banyan Ave Unit A
- 9502 Banyan Ave
- 9307 N 16th St
- 1302 E Annie St
- 1505 E 99th Ave
- 1711 E Sewaha St
- 1407 E 99th Ave
- 1430 E 99th Ave
- 1801 E Annie St
- 1108 E Annie St
- 9610 N 12th St
- 9902 W Club Ln
- 9602 N 11th St
- 9318 N 11th St
- 9801 N 11th St
- 8808 N Brooks St
- 9303 N 19th St
- 1712 N Club Ct
- 2008 E Annie St
- 9415 N 15th St
- 9409 N 15th St
- 9410 N Semmes St
- 9412 N Semmes St
- 9408 N Semmes St
- 1421 E Annie St
- 1501 E Annie St
- 9412 N 15th St
- 9406 N Semmes St
- 9408 N 15th St
- 1415 E Annie St
- 1503 E Annie St
- 9404 N Semmes St
- 9406 N 15th St
- 9404 R N Semmes St
- 1502 E Sewaha St Unit B
- 1502 E Sewaha St Unit AB
- 1504 E Sewaha St
- 1413 E Annie St
- 9404 N 15th St