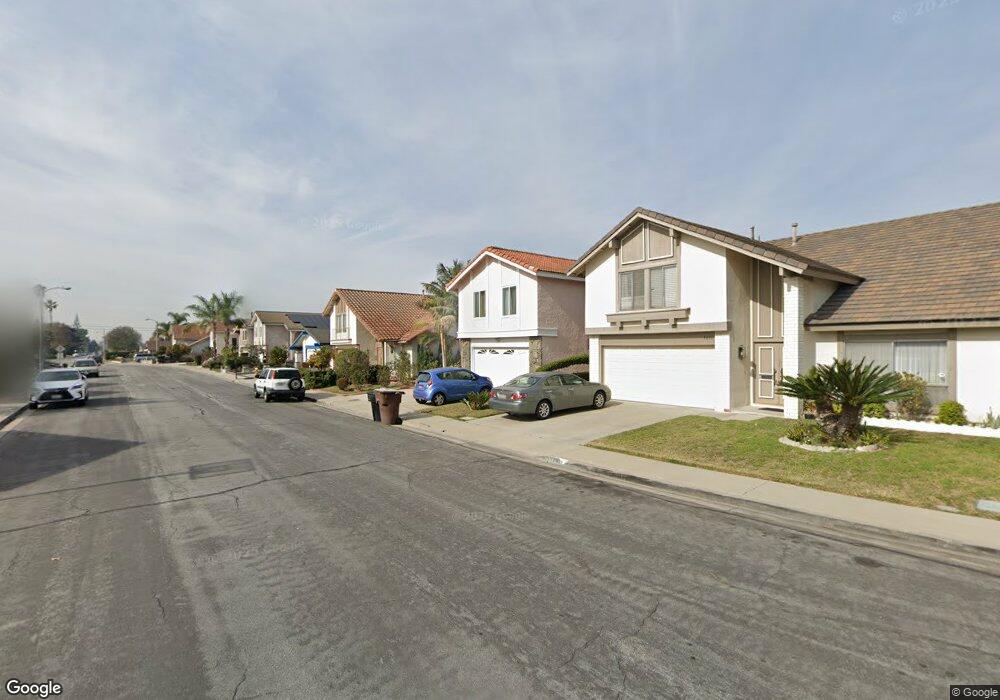
9421 Imperial Ave Garden Grove, CA 92844
Estimated Value: $882,000 - $1,133,000
3
Beds
2
Baths
1,521
Sq Ft
$651/Sq Ft
Est. Value
About This Home
This home is located at 9421 Imperial Ave, Garden Grove, CA 92844 and is currently estimated at $990,231, approximately $651 per square foot. 9421 Imperial Ave is a home located in Orange County with nearby schools including Sunnyside Elementary School, Donald S. Jordan Intermediate School, and Bolsa Grande High School.
Ownership History
Date
Name
Owned For
Owner Type
Purchase Details
Closed on
Jun 7, 2002
Sold by
Nguyen Phuong Thuy
Bought by
Nguyen Phuong Thuy and Dibrezzo Michael Thomas
Current Estimated Value
Purchase Details
Closed on
Mar 4, 1999
Sold by
Tina Le
Bought by
Nguyen Phuong Thuy
Purchase Details
Closed on
Dec 18, 1996
Sold by
Vanvanle Ha Van
Bought by
Le Tina Marrie
Purchase Details
Closed on
Dec 14, 1996
Sold by
Nguyen Phuong Thuy
Bought by
Le Tina Marrie
Purchase Details
Closed on
Nov 20, 1995
Sold by
Hung Chen Fung and Hung Cassey
Bought by
Nguyen Phuong Thuy
Home Financials for this Owner
Home Financials are based on the most recent Mortgage that was taken out on this home.
Original Mortgage
$100,000
Interest Rate
7.41%
Create a Home Valuation Report for This Property
The Home Valuation Report is an in-depth analysis detailing your home's value as well as a comparison with similar homes in the area
Home Values in the Area
Average Home Value in this Area
Purchase History
| Date | Buyer | Sale Price | Title Company |
|---|---|---|---|
| Nguyen Phuong Thuy | -- | -- | |
| Nguyen Phuong Thuy | -- | -- | |
| Le Tina Marrie | -- | Orange Coast Title | |
| Le Tina Marrie | -- | Fidelity National Title Ins | |
| Nguyen Phuong Thuy | $167,000 | Fidelity National Title Ins |
Source: Public Records
Mortgage History
| Date | Status | Borrower | Loan Amount |
|---|---|---|---|
| Previous Owner | Nguyen Phuong Thuy | $100,000 |
Source: Public Records
Tax History Compared to Growth
Tax History
| Year | Tax Paid | Tax Assessment Tax Assessment Total Assessment is a certain percentage of the fair market value that is determined by local assessors to be the total taxable value of land and additions on the property. | Land | Improvement |
|---|---|---|---|---|
| 2025 | $5,331 | $703,828 | $559,829 | $143,999 |
| 2024 | $5,331 | $416,161 | $274,034 | $142,127 |
| 2023 | $5,232 | $408,001 | $268,660 | $139,341 |
| 2022 | $5,121 | $400,001 | $263,392 | $136,609 |
| 2021 | $5,067 | $392,158 | $258,227 | $133,931 |
| 2020 | $5,000 | $388,137 | $255,579 | $132,558 |
| 2019 | $4,906 | $380,527 | $250,568 | $129,959 |
| 2018 | $4,808 | $373,066 | $245,655 | $127,411 |
| 2017 | $4,743 | $365,751 | $240,838 | $124,913 |
| 2016 | $4,510 | $358,580 | $236,116 | $122,464 |
| 2015 | $4,448 | $353,194 | $232,569 | $120,625 |
| 2014 | $4,341 | $346,276 | $228,013 | $118,263 |
Source: Public Records
Map
Nearby Homes
- 13100 Gilbert St Unit 28
- 9651 Crosby Ave
- 9691 Central Ave
- 9370 W Garden Grove Blvd
- 13392 Magnolia St
- 13411 Magnolia St
- 12861 Alamitos Way
- 9931 Central Ave
- 8833 Brookdale Dr
- 10002 Central Ave Unit 27
- 10002 Central Ave
- 10094 Larson Ave
- 13839 Magnolia St
- 9200 Westminster Blvd Unit 25
- 13175 Creek View Dr Unit F
- 10361 Garden Grove Blvd Unit 30
- 8784 Hewitt Place Unit 12
- 8520 Lake Knoll Ave Unit B
- 13252 Newland St Unit A-D
- 12941 Josephine St
- 9411 Imperial Ave
- 9431 Imperial Ave
- 9401 Imperial Ave
- 9441 Imperial Ave
- 9442 Central Ave
- 9422 Central Ave
- 9391 Imperial Ave
- 9422 Imperial Ave
- 9462 Central Ave
- 9412 Imperial Ave
- 9432 Imperial Ave
- 9402 Central Ave
- 9402 Imperial Ave
- 9451 Imperial Ave
- 9442 Imperial Ave
- 9381 Imperial Ave
- 9392 Imperial Ave
- 9392 Central Ave
- 9461 Imperial Ave
- 9382 Imperial Ave