Estimated Value: $292,896 - $319,000
3
Beds
2
Baths
1,502
Sq Ft
$204/Sq Ft
Est. Value
About This Home
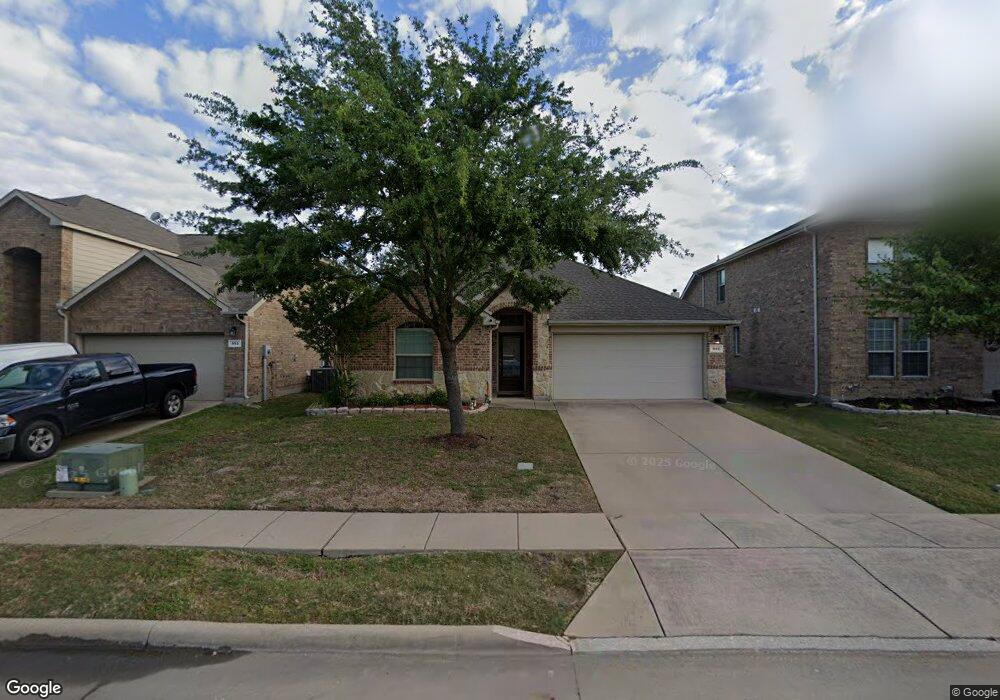
This home is located at 943 Austin Ln, Lavon, TX 75166 and is currently estimated at $306,224, approximately $203 per square foot. 943 Austin Ln is a home located in Collin County with nearby schools including Nesmith Elementary School, Community High School, and Wylie Preparatory Academy.
Ownership History
Date
Name
Owned For
Owner Type
Purchase Details
Closed on
Dec 30, 2019
Sold by
Noho Real Property Ii Llc
Bought by
Guevara Oscar R
Current Estimated Value
Home Financials for this Owner
Home Financials are based on the most recent Mortgage that was taken out on this home.
Original Mortgage
$209,142
Outstanding Balance
$183,512
Interest Rate
3.25%
Mortgage Type
FHA
Estimated Equity
$122,712
Purchase Details
Closed on
Jul 1, 2019
Sold by
Stephens Jennifer and Stephens Bryan
Bought by
Noho Real Property Ii Llc
Purchase Details
Closed on
Oct 29, 2010
Sold by
Lennar Homes Of Texas Sales & Marketing
Bought by
Ogas John D and Ogas Jennifer C
Home Financials for this Owner
Home Financials are based on the most recent Mortgage that was taken out on this home.
Original Mortgage
$160,569
Interest Rate
4.36%
Mortgage Type
New Conventional
Create a Home Valuation Report for This Property
The Home Valuation Report is an in-depth analysis detailing your home's value as well as a comparison with similar homes in the area
Home Values in the Area
Average Home Value in this Area
Purchase History
| Date | Buyer | Sale Price | Title Company |
|---|---|---|---|
| Guevara Oscar R | -- | Capital Title | |
| Noho Real Property Ii Llc | -- | None Available | |
| Ogas John D | -- | Natgf | |
| Lennar Homes Of Texas Sales & Marketing | -- | Natgf |
Source: Public Records
Mortgage History
| Date | Status | Borrower | Loan Amount |
|---|---|---|---|
| Open | Guevara Oscar R | $209,142 | |
| Previous Owner | Ogas John D | $160,569 |
Source: Public Records
Tax History Compared to Growth
Tax History
| Year | Tax Paid | Tax Assessment Tax Assessment Total Assessment is a certain percentage of the fair market value that is determined by local assessors to be the total taxable value of land and additions on the property. | Land | Improvement |
|---|---|---|---|---|
| 2025 | $4,341 | $263,132 | $85,000 | $178,132 |
| 2024 | $4,341 | $266,604 | $85,000 | $196,818 |
| 2023 | $4,341 | $242,367 | $85,000 | $199,055 |
| 2022 | $4,641 | $220,334 | $70,000 | $187,873 |
| 2021 | $4,384 | $200,304 | $55,000 | $145,304 |
| 2020 | $4,467 | $193,925 | $55,000 | $138,925 |
| 2019 | $4,614 | $193,257 | $55,000 | $138,257 |
| 2018 | $4,257 | $180,934 | $55,000 | $125,934 |
| 2017 | $4,062 | $174,193 | $55,000 | $119,193 |
| 2016 | $3,721 | $158,405 | $40,000 | $118,405 |
| 2015 | $2,794 | $147,511 | $35,000 | $112,511 |
Source: Public Records
Map
Nearby Homes
- 975 Crockett Dr
- 00000 State Highway 205
- 682 Crockett Dr
- 638 Bonham Dr
- 1070 Shepard Ln
- Seaberry Plan at Bear Creek at Grand Heritage - Bear Creek Classic 60
- Willow Plan at Bear Creek at Grand Heritage - Bear Creek Elements
- Dogwood III Plan at Bear Creek at Grand Heritage - Bear Creek Classic 50
- Magnolia Plan at Bear Creek at Grand Heritage - Bear Creek Classic 60
- Woodrose Plan at Bear Creek at Grand Heritage - Bear Creek Elements
- Cypress II Plan at Bear Creek at Grand Heritage - Bear Creek Classic 60
- Kirlin Plan at Bear Creek at Grand Heritage
- Rose III Plan at Bear Creek at Grand Heritage - Bear Creek Classic 60
- Portico Plan at Bear Creek at Grand Heritage
- Rose Plan at Bear Creek at Grand Heritage - Bear Creek Classic 60
- Magnolia II Plan at Bear Creek at Grand Heritage - Bear Creek Classic 60
- Carolina II Plan at Bear Creek at Grand Heritage - Bear Creek Classic 50
- Hawthorne Plan at Bear Creek at Grand Heritage - Bear Creek Classic 60
- Magnolia III Plan at Bear Creek at Grand Heritage - Bear Creek Classic 50
- Carolina III Plan at Bear Creek at Grand Heritage - Bear Creek Classic 60