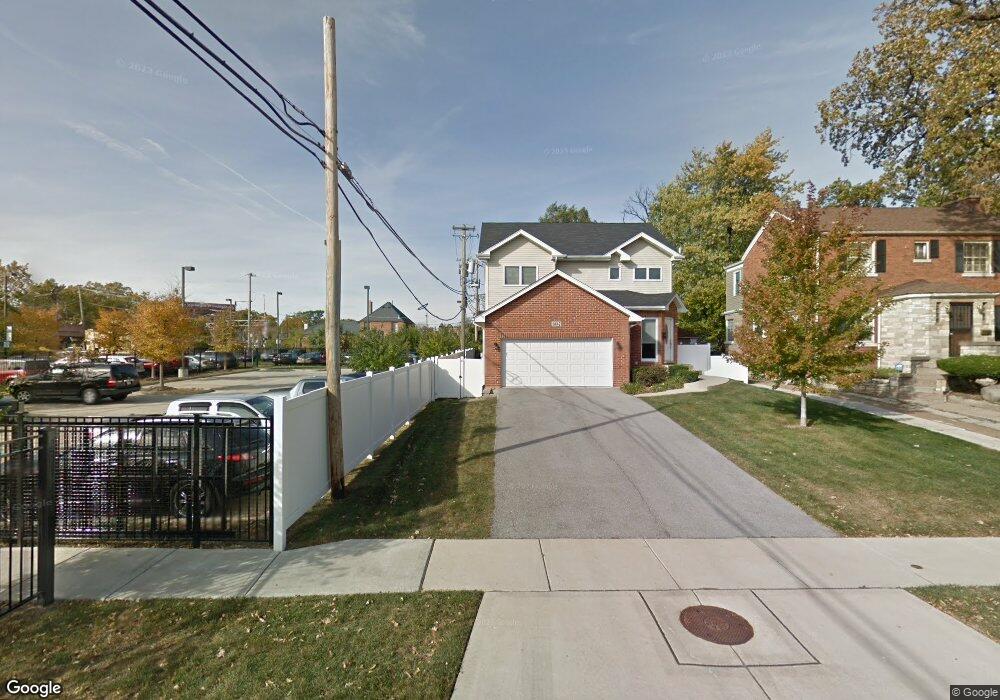
9442 S Vanderpoel Ave Chicago, IL 60643
Beverly NeighborhoodEstimated Value: $408,000 - $629,000
3
Beds
3
Baths
2,000
Sq Ft
$256/Sq Ft
Est. Value
About This Home
This home is located at 9442 S Vanderpoel Ave, Chicago, IL 60643 and is currently estimated at $512,452, approximately $256 per square foot. 9442 S Vanderpoel Ave is a home located in Cook County with nearby schools including Kellogg Elementary School, Morgan Park High School, and CICS - Longwood Campus.
Ownership History
Date
Name
Owned For
Owner Type
Purchase Details
Closed on
Apr 19, 2013
Sold by
Broadway Marcus
Bought by
Broadway Margie
Current Estimated Value
Home Financials for this Owner
Home Financials are based on the most recent Mortgage that was taken out on this home.
Original Mortgage
$313,637
Outstanding Balance
$221,686
Interest Rate
3.5%
Mortgage Type
FHA
Estimated Equity
$290,766
Purchase Details
Closed on
Dec 29, 2009
Sold by
First Choice Neighborhood Homes Llc
Bought by
Broadway Marcus and Broadway Margie
Home Financials for this Owner
Home Financials are based on the most recent Mortgage that was taken out on this home.
Original Mortgage
$322,954
Interest Rate
5.5%
Mortgage Type
FHA
Purchase Details
Closed on
Oct 12, 2006
Sold by
Chicago Title Land Trust Co
Bought by
First Choice Neighborhood Homes Llc
Create a Home Valuation Report for This Property
The Home Valuation Report is an in-depth analysis detailing your home's value as well as a comparison with similar homes in the area
Home Values in the Area
Average Home Value in this Area
Purchase History
| Date | Buyer | Sale Price | Title Company |
|---|---|---|---|
| Broadway Margie | -- | Stewart Title Company | |
| Broadway Marcus | $340,000 | Ctic | |
| First Choice Neighborhood Homes Llc | $57,000 | Pntn |
Source: Public Records
Mortgage History
| Date | Status | Borrower | Loan Amount |
|---|---|---|---|
| Open | Broadway Margie | $313,637 | |
| Closed | Broadway Marcus | $322,954 |
Source: Public Records
Tax History Compared to Growth
Tax History
| Year | Tax Paid | Tax Assessment Tax Assessment Total Assessment is a certain percentage of the fair market value that is determined by local assessors to be the total taxable value of land and additions on the property. | Land | Improvement |
|---|---|---|---|---|
| 2024 | $5,706 | $38,535 | $9,338 | $29,197 |
| 2023 | $5,544 | $30,294 | $7,470 | $22,824 |
| 2022 | $5,544 | $30,294 | $7,470 | $22,824 |
| 2021 | $5,438 | $30,294 | $7,470 | $22,824 |
| 2020 | $3,291 | $17,840 | $5,602 | $12,238 |
| 2019 | $3,215 | $19,392 | $5,602 | $13,790 |
| 2018 | $3,160 | $19,392 | $5,602 | $13,790 |
| 2017 | $5,624 | $29,442 | $4,855 | $24,587 |
| 2016 | $5,410 | $29,442 | $4,855 | $24,587 |
| 2015 | $4,927 | $29,442 | $4,855 | $24,587 |
| 2014 | $5,441 | $31,821 | $4,482 | $27,339 |
| 2013 | $5,322 | $31,821 | $4,482 | $27,339 |
Source: Public Records
Map
Nearby Homes
- 1744 W 95th Place Unit 1744
- 9400 S Charles St
- 9427 S Charles St
- 9340 S Vanderpoel Ave
- 1246 & 1244 W 95th St
- 9547 S Longwood Dr
- 9633 S Prospect Ave
- 9556 S Winchester Ave
- 9527 S Damen Ave
- 9322 S Justine St
- 9422 S Laflin St
- 9230 S Ashland Ave
- 9624 S Winchester Ave
- 1715 W 91st Place
- 9748 S Vanderpoel Ave
- 9237 S Justine St
- 9332 S Bishop St
- 1971 W 97th St
- 9609 S Winston Ave
- 9305 S Hoyne Ave
- 9436 S Vanderpoel Ave
- 1800 W 95th St
- 9428 S Vanderpoel Ave
- 9432 S Vanderpoel Ave
- 9424 S Vanderpoel Ave
- 9420 S Vanderpoel Ave
- 9443 S Vanderpoel Ave
- 9441 S Vanderpoel Ave
- 9437 S Vanderpoel Ave
- 9433 S Vanderpoel Ave
- 9429 S Vanderpoel Ave
- 9425 S Vanderpoel Ave
- 9410 S Vanderpoel Ave
- 9421 S Vanderpoel Ave
- 1759 W 95th St
- 9441 S Longwood Dr
- 9439 S Longwood Dr
- 9505 S Wood St
- 9417 S Vanderpoel Ave
- 1765 W 95th St