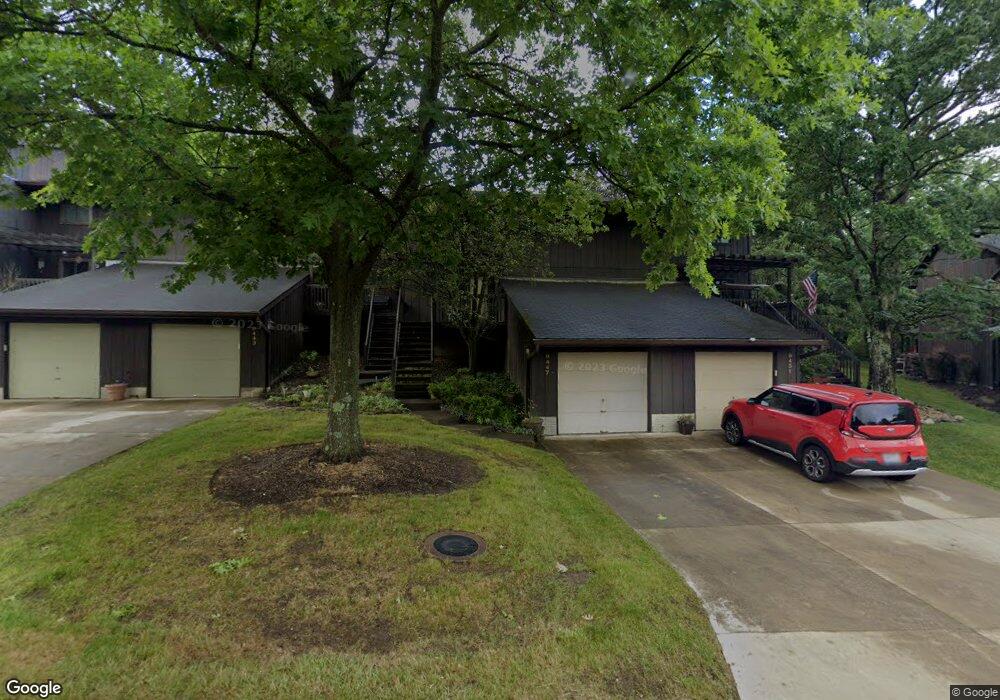
9447 Langdon Ln Unit 215 North Royalton, OH 44133
Estimated Value: $176,000 - $226,000
3
Beds
2
Baths
1,488
Sq Ft
$141/Sq Ft
Est. Value
About This Home
This home is located at 9447 Langdon Ln Unit 215, North Royalton, OH 44133 and is currently estimated at $209,969, approximately $141 per square foot. 9447 Langdon Ln Unit 215 is a home located in Cuyahoga County with nearby schools including North Royalton Middle School, North Royalton High School, and Saint Albert the Great Roman Catholic School.
Ownership History
Date
Name
Owned For
Owner Type
Purchase Details
Closed on
Feb 18, 2014
Sold by
Ashbrook Michael S and Bloch Anita I
Bought by
Bloch Anita L
Current Estimated Value
Purchase Details
Closed on
Jan 22, 2013
Sold by
Bloch Anita I and Ashbrook Anita I
Bought by
Bloch Anita I and Ashbrook Anita I
Purchase Details
Closed on
Feb 9, 2000
Sold by
Glissman Carl S
Bought by
Bloch Anita I
Home Financials for this Owner
Home Financials are based on the most recent Mortgage that was taken out on this home.
Original Mortgage
$94,050
Outstanding Balance
$31,204
Interest Rate
8.21%
Estimated Equity
$178,765
Purchase Details
Closed on
Apr 18, 1983
Sold by
Dumek Dale J and D R
Bought by
Glissman Carl S
Purchase Details
Closed on
Jan 1, 1979
Bought by
Dumek Dale J and D R
Create a Home Valuation Report for This Property
The Home Valuation Report is an in-depth analysis detailing your home's value as well as a comparison with similar homes in the area
Home Values in the Area
Average Home Value in this Area
Purchase History
| Date | Buyer | Sale Price | Title Company |
|---|---|---|---|
| Bloch Anita L | -- | Attorney | |
| Bloch Anita I | -- | None Available | |
| Bloch Anita I | $49,000 | Midland Title Security Inc | |
| Glissman Carl S | $65,000 | -- | |
| Dumek Dale J | -- | -- |
Source: Public Records
Mortgage History
| Date | Status | Borrower | Loan Amount |
|---|---|---|---|
| Open | Bloch Anita I | $94,050 |
Source: Public Records
Tax History Compared to Growth
Tax History
| Year | Tax Paid | Tax Assessment Tax Assessment Total Assessment is a certain percentage of the fair market value that is determined by local assessors to be the total taxable value of land and additions on the property. | Land | Improvement |
|---|---|---|---|---|
| 2024 | $3,686 | $63,455 | $6,335 | $57,120 |
| 2023 | $3,108 | $49,070 | $4,900 | $44,170 |
| 2022 | $3,087 | $49,070 | $4,900 | $44,170 |
| 2021 | $3,119 | $49,070 | $4,900 | $44,170 |
| 2020 | $2,486 | $37,170 | $3,710 | $33,460 |
| 2019 | $2,413 | $106,200 | $10,600 | $95,600 |
| 2018 | $2,076 | $37,170 | $3,710 | $33,460 |
| 2017 | $1,828 | $26,610 | $2,980 | $23,630 |
| 2016 | $1,713 | $26,610 | $2,980 | $23,630 |
| 2015 | $2,158 | $26,610 | $2,980 | $23,630 |
| 2014 | $2,158 | $33,250 | $3,710 | $29,540 |
Source: Public Records
Map
Nearby Homes
- 11550 York Rd
- 9530 Cove Dr Unit C-25
- 9510 Cove Dr Unit C12
- 9035 Wallings Rd
- 9611 Sunrise Blvd Unit K2
- 9660 Cove Dr Unit F13
- 9710 Cove Dr Unit 23G
- 9761 Sunrise Blvd
- 9800 Cove Dr Unit H2
- 10342 Independence Dr Unit 21B
- 10364 Independence Dr Unit 19c
- 9821 Sunrise Blvd Unit o1
- 10560 Independence Dr Unit 25A
- 11445 Harbour Light Dr
- 12906 Cartwright Pkwy
- 13000 Cartwright Pkwy
- 12701 Gordon St
- 10641 Albion Rd
- 7554 Margaret Dr
- 7595 Margaret Dr
- 9435 Langdon Ln Unit 212
- 9431 Langdon Ln
- 9439 Langdon Ln
- 9451 Langdon Ln
- 9443 Langdon Ln
- 9443 Langdon Ln Unit 214
- 9431 Langdon Ln Unit 211
- 9439 Langdon Ln Unit 213
- 9423 Langdon Ln Unit 209
- 9427 Langdon Ln Unit 210
- 9411 Langdon Ln Unit 206
- 9407 Langdon Ln Unit 205
- 9419 Langdon Ln
- 9415 Langdon Ln
- 9463 Langdon Ln Unit 219
- 9455 Langdon Ln Unit 217
- 9475 Langdon Ln
- 9471 Langdon Ln
- 9467 Langdon Ln
- 9459 Langdon Ln