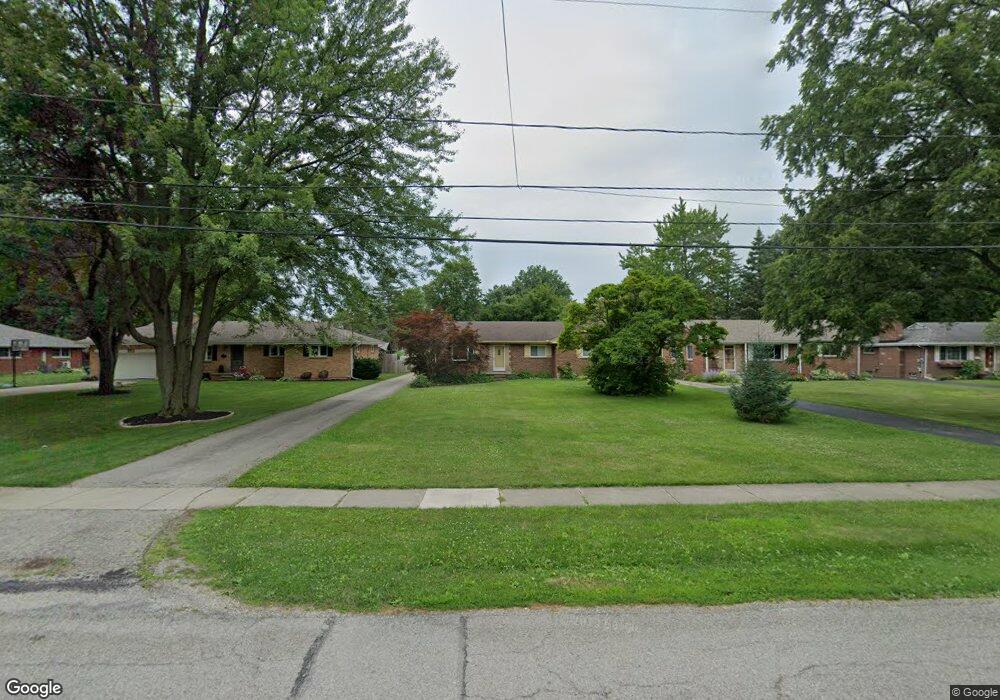
946 Mulberry St Perrysburg, OH 43551
Estimated Value: $255,084 - $289,000
3
Beds
1
Bath
1,265
Sq Ft
$214/Sq Ft
Est. Value
About This Home
This home is located at 946 Mulberry St, Perrysburg, OH 43551 and is currently estimated at $270,271, approximately $213 per square foot. 946 Mulberry St is a home located in Wood County with nearby schools including Frank Elementary School, Perrysburg Junior High School, and Perrysburg High School.
Ownership History
Date
Name
Owned For
Owner Type
Purchase Details
Closed on
Mar 28, 2001
Sold by
Durand Amy N and Durand Troy A
Bought by
Patterson Brian R and Patterson Kristina E
Current Estimated Value
Home Financials for this Owner
Home Financials are based on the most recent Mortgage that was taken out on this home.
Original Mortgage
$127,350
Outstanding Balance
$46,946
Interest Rate
7.02%
Estimated Equity
$223,325
Purchase Details
Closed on
Aug 26, 1997
Sold by
Mishka William J
Bought by
Durand Troy A and Durand Amy N
Home Financials for this Owner
Home Financials are based on the most recent Mortgage that was taken out on this home.
Original Mortgage
$127,700
Interest Rate
7.56%
Mortgage Type
New Conventional
Purchase Details
Closed on
Aug 25, 1994
Sold by
Mckell Edward C
Bought by
Mishka William J and Mishka Ann M
Home Financials for this Owner
Home Financials are based on the most recent Mortgage that was taken out on this home.
Original Mortgage
$93,600
Interest Rate
8.72%
Mortgage Type
New Conventional
Purchase Details
Closed on
Mar 10, 1992
Bought by
Mckell Edward C
Create a Home Valuation Report for This Property
The Home Valuation Report is an in-depth analysis detailing your home's value as well as a comparison with similar homes in the area
Home Values in the Area
Average Home Value in this Area
Purchase History
| Date | Buyer | Sale Price | Title Company |
|---|---|---|---|
| Patterson Brian R | $141,500 | -- | |
| Durand Troy A | $141,900 | -- | |
| Mishka William J | $104,000 | -- | |
| Mckell Edward C | $95,000 | -- |
Source: Public Records
Mortgage History
| Date | Status | Borrower | Loan Amount |
|---|---|---|---|
| Open | Patterson Brian R | $127,350 | |
| Previous Owner | Durand Troy A | $127,700 | |
| Previous Owner | Mishka William J | $93,600 |
Source: Public Records
Tax History Compared to Growth
Tax History
| Year | Tax Paid | Tax Assessment Tax Assessment Total Assessment is a certain percentage of the fair market value that is determined by local assessors to be the total taxable value of land and additions on the property. | Land | Improvement |
|---|---|---|---|---|
| 2024 | $4,308 | $74,235 | $13,580 | $60,655 |
| 2023 | $4,308 | $74,240 | $13,580 | $60,660 |
| 2021 | $3,591 | $56,950 | $11,760 | $45,190 |
| 2020 | $3,571 | $56,950 | $11,760 | $45,190 |
| 2019 | $3,154 | $48,790 | $11,760 | $37,030 |
| 2018 | $2,800 | $48,790 | $11,760 | $37,030 |
| 2017 | $2,692 | $48,790 | $11,760 | $37,030 |
| 2016 | $2,694 | $45,190 | $10,430 | $34,760 |
| 2015 | $2,694 | $45,190 | $10,430 | $34,760 |
| 2014 | $2,718 | $45,190 | $10,430 | $34,760 |
| 2013 | $2,780 | $45,190 | $10,430 | $34,760 |
Source: Public Records
Map
Nearby Homes
- 865 Mulberry St
- 872 Cherry St
- 412 W South Boundary St
- 621 W Boundary St
- 1016 Walnut St
- 204 W 8th St
- 1085 Birch Dr
- 122 W 6th St
- 11966 Eckel Junction Rd
- 454 S Ridge Dr
- 528 Elm St
- 505 Boody Ct
- 664 Little Creek Dr
- 622 Turnbury Ln Unit 622
- 135 Birchcrest Dr
- 832 Turnbury Ln Unit 28
- 130 Cedar Ct
- 208 E Indiana Ave
- 170 Edgewood Dr
- 471 Rutledge Ct