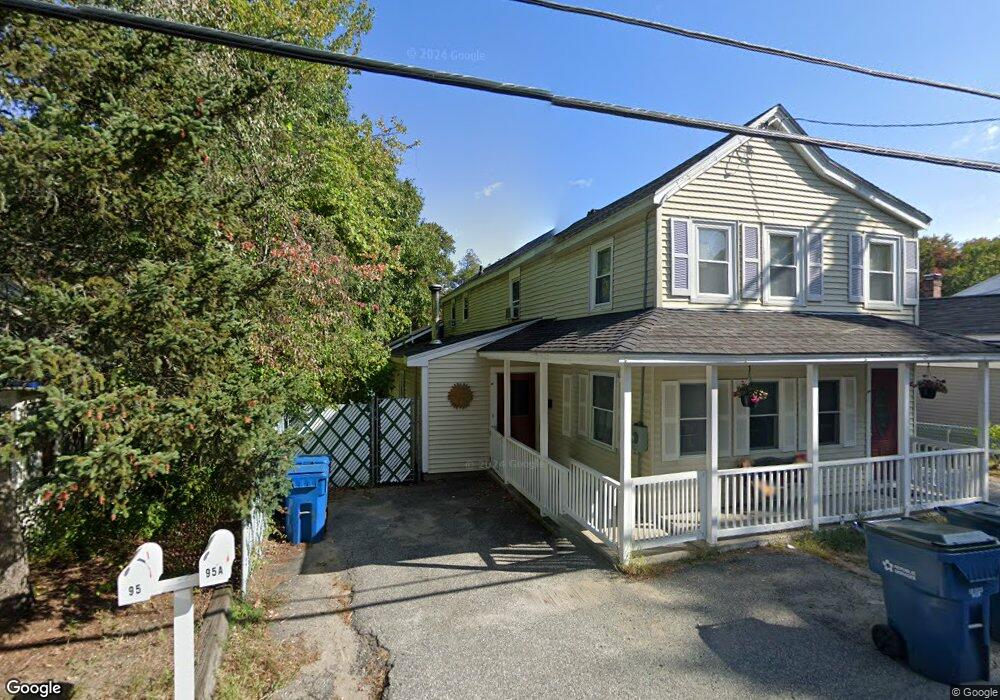
95 Brown St Tewksbury, MA 01876
Estimated Value: $516,000 - $764,000
3
Beds
2
Baths
2,445
Sq Ft
$280/Sq Ft
Est. Value
About This Home
This home is located at 95 Brown St, Tewksbury, MA 01876 and is currently estimated at $684,041, approximately $279 per square foot. 95 Brown St is a home located in Middlesex County with nearby schools including Heath-Brook Elementary School and Abundant Life Christian School and Childcare.
Ownership History
Date
Name
Owned For
Owner Type
Purchase Details
Closed on
Jun 1, 1987
Sold by
Bisazza Cosmo A
Bought by
Mugford Paul
Current Estimated Value
Home Financials for this Owner
Home Financials are based on the most recent Mortgage that was taken out on this home.
Original Mortgage
$55,000
Interest Rate
10.25%
Mortgage Type
Purchase Money Mortgage
Create a Home Valuation Report for This Property
The Home Valuation Report is an in-depth analysis detailing your home's value as well as a comparison with similar homes in the area
Home Values in the Area
Average Home Value in this Area
Purchase History
| Date | Buyer | Sale Price | Title Company |
|---|---|---|---|
| Mugford Paul | $113,000 | -- |
Source: Public Records
Mortgage History
| Date | Status | Borrower | Loan Amount |
|---|---|---|---|
| Open | Mugford Paul | $100,000 | |
| Closed | Mugford Paul | $75,000 | |
| Closed | Mugford Paul | $40,000 | |
| Closed | Mugford Paul | $55,000 |
Source: Public Records
Tax History Compared to Growth
Tax History
| Year | Tax Paid | Tax Assessment Tax Assessment Total Assessment is a certain percentage of the fair market value that is determined by local assessors to be the total taxable value of land and additions on the property. | Land | Improvement |
|---|---|---|---|---|
| 2025 | $7,662 | $579,600 | $256,000 | $323,600 |
| 2024 | $7,247 | $541,200 | $243,900 | $297,300 |
| 2023 | $7,218 | $511,900 | $221,700 | $290,200 |
| 2022 | $6,802 | $447,500 | $192,900 | $254,600 |
| 2021 | $15,383 | $412,000 | $166,100 | $245,900 |
| 2020 | $15,062 | $390,500 | $158,100 | $232,400 |
| 2019 | $5,639 | $356,000 | $150,600 | $205,400 |
| 2018 | $14,157 | $328,200 | $150,600 | $177,600 |
| 2017 | $12,476 | $323,200 | $150,600 | $172,600 |
| 2016 | $5,054 | $309,100 | $150,600 | $158,500 |
| 2015 | $5,068 | $309,600 | $157,300 | $152,300 |
| 2014 | $4,785 | $297,000 | $157,300 | $139,700 |
Source: Public Records
Map
Nearby Homes