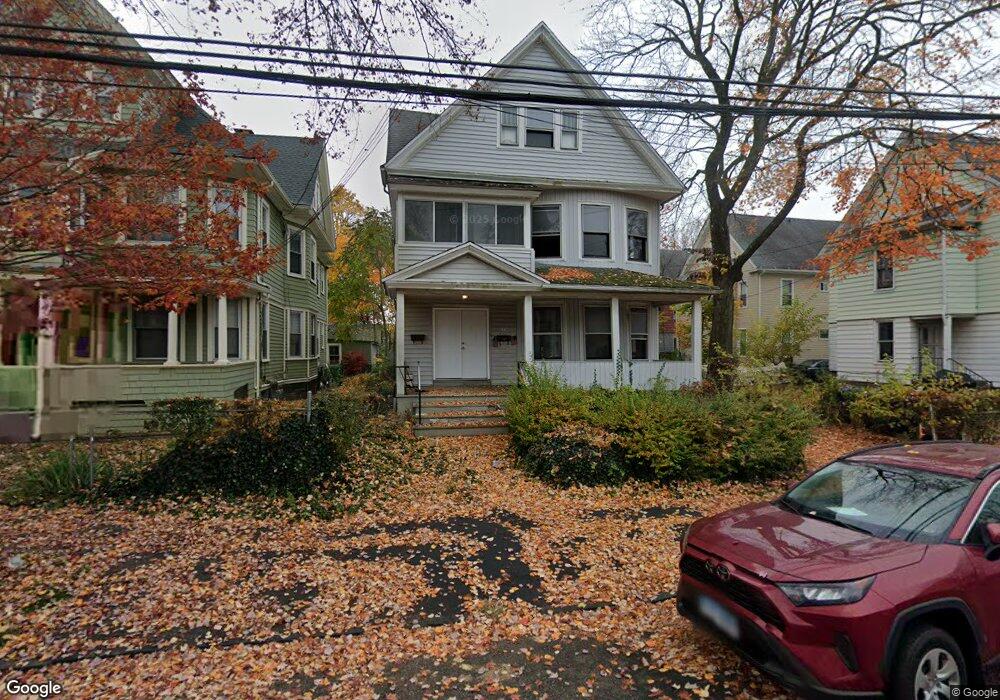
95 Elmwood Ave Unit 97 Bridgeport, CT 06605
West End-West Side NeighborhoodEstimated Value: $378,004 - $575,000
4
Beds
2
Baths
3,427
Sq Ft
$146/Sq Ft
Est. Value
About This Home
This home is located at 95 Elmwood Ave Unit 97, Bridgeport, CT 06605 and is currently estimated at $500,501, approximately $146 per square foot. 95 Elmwood Ave Unit 97 is a home located in Fairfield County with nearby schools including James J. Curiale School, Bassick High School, and Park City Prep Charter School.
Ownership History
Date
Name
Owned For
Owner Type
Purchase Details
Closed on
May 10, 2022
Sold by
79 Lansing Llc
Bought by
New Wave Holdings Llc
Current Estimated Value
Purchase Details
Closed on
Feb 18, 2022
Sold by
New Wave Holdings Llc
Bought by
79 Lansing Llc
Home Financials for this Owner
Home Financials are based on the most recent Mortgage that was taken out on this home.
Original Mortgage
$281,250
Interest Rate
3.69%
Mortgage Type
Commercial
Purchase Details
Closed on
Mar 25, 2021
Sold by
Stumbris Kenneth E Est and Stumbris
Bought by
New Wave Holdings Llc
Purchase Details
Closed on
Dec 16, 1986
Bought by
Stumbris Kenneth
Create a Home Valuation Report for This Property
The Home Valuation Report is an in-depth analysis detailing your home's value as well as a comparison with similar homes in the area
Home Values in the Area
Average Home Value in this Area
Purchase History
| Date | Buyer | Sale Price | Title Company |
|---|---|---|---|
| New Wave Holdings Llc | -- | None Available | |
| New Wave Holdings Llc | -- | None Available | |
| New Wave Holdings Llc | -- | None Available | |
| 79 Lansing Llc | -- | None Available | |
| 79 Lansing Llc | -- | None Available | |
| 79 Lansing Llc | -- | None Available | |
| New Wave Holdings Llc | $171,111 | None Available | |
| New Wave Holdings Llc | $171,111 | None Available | |
| New Wave Holdings Llc | $171,111 | None Available | |
| Stumbris Kenneth | -- | -- |
Source: Public Records
Mortgage History
| Date | Status | Borrower | Loan Amount |
|---|---|---|---|
| Previous Owner | 79 Lansing Llc | $281,250 |
Source: Public Records
Tax History Compared to Growth
Tax History
| Year | Tax Paid | Tax Assessment Tax Assessment Total Assessment is a certain percentage of the fair market value that is determined by local assessors to be the total taxable value of land and additions on the property. | Land | Improvement |
|---|---|---|---|---|
| 2025 | $7,655 | $176,170 | $48,200 | $127,970 |
| 2024 | $7,655 | $176,170 | $48,200 | $127,970 |
| 2023 | $7,655 | $176,170 | $48,200 | $127,970 |
| 2022 | $7,655 | $176,170 | $48,200 | $127,970 |
| 2021 | $7,655 | $176,170 | $48,200 | $127,970 |
| 2020 | $6,742 | $124,870 | $20,080 | $104,790 |
| 2019 | $6,742 | $124,870 | $20,080 | $104,790 |
| 2018 | $6,789 | $124,870 | $20,080 | $104,790 |
| 2017 | $6,789 | $124,870 | $20,080 | $104,790 |
| 2016 | $6,789 | $124,870 | $20,080 | $104,790 |
| 2015 | $7,105 | $168,360 | $24,300 | $144,060 |
| 2014 | $7,105 | $168,360 | $24,300 | $144,060 |
Source: Public Records
Map
Nearby Homes
- 700 Laurel Ave
- 697 Laurel Ave
- 393 Laurel Ave Unit 203
- 393 Laurel Ave Unit 415
- 414 Wood Ave
- 670 Clinton Ave
- 533 Clinton Ave
- 468 Colorado Ave
- 566 Wood Ave
- 826 Norman St
- 60 Olive St
- 212 Denver Ave
- 99 Denver Ave Unit 101
- 115 Denver Ave Unit 117
- 592 Norman St Unit 594
- 1373 Iranistan Ave
- 1199 Iranistan Ave Unit 1201
- 357 Norman St
- 687 Wood Ave
- 255 Poplar St
- 550 Laurel Ave Unit 552
- 87 Elmwood Ave Unit 89
- 544 Laurel Ave Unit 546
- 544 Laurel Ave Unit 1
- 95 Elmwood Avenue Edge
- 540 Laurel Ave
- 536 Laurel Ave Unit 538
- 79 Elmwood Ave Unit 81
- 526 Laurel Ave Unit 528
- 94 Elmwood Ave
- 580 Laurel Ave Unit 2
- 578 Laurel Ave Unit 580
- 71 Elmwood Ave Unit 73
- 137 Elmwood Ave
- 137 Elmwood Ave Unit 139
- 137 Elmwood Ave Unit 1
- 17 Elmwood Ave Unit 2
- 150 Elmwood Ave
- 80 Elmwood Ave Unit 82