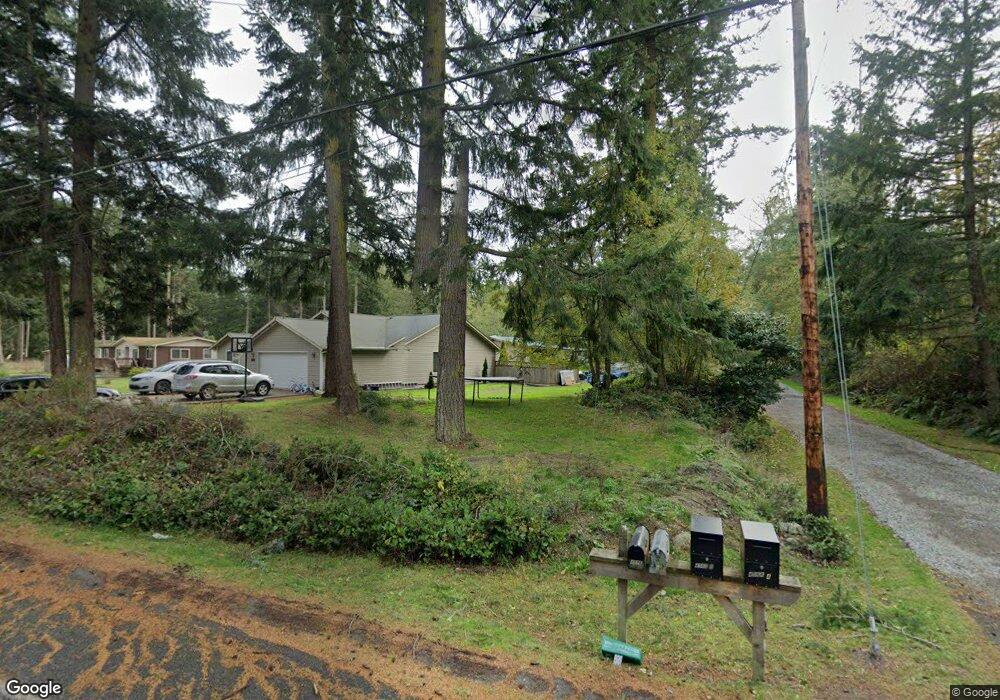
95 W Troxell Rd Oak Harbor, WA 98277
Estimated Value: $637,403 - $747,000
3
Beds
2
Baths
2,152
Sq Ft
$314/Sq Ft
Est. Value
About This Home
This home is located at 95 W Troxell Rd, Oak Harbor, WA 98277 and is currently estimated at $675,601, approximately $313 per square foot. 95 W Troxell Rd is a home located in Island County with nearby schools including Crescent Harbor Elementary School, North Whidbey Middle School, and Oak Harbor High School.
Ownership History
Date
Name
Owned For
Owner Type
Purchase Details
Closed on
Dec 11, 2013
Sold by
Fannie Mae
Bought by
Witmer Dane and Witmer Jaemee Rozz M
Current Estimated Value
Home Financials for this Owner
Home Financials are based on the most recent Mortgage that was taken out on this home.
Original Mortgage
$229,591
Outstanding Balance
$169,918
Interest Rate
4.04%
Mortgage Type
New Conventional
Estimated Equity
$505,683
Purchase Details
Closed on
Feb 19, 2013
Sold by
Johnson Dale Alan and Johnson Charlene T
Bought by
Federal National Mortgage Association
Purchase Details
Closed on
Apr 13, 2005
Sold by
Va
Bought by
Johnson Dale Alan and Johnson Charlene T
Home Financials for this Owner
Home Financials are based on the most recent Mortgage that was taken out on this home.
Original Mortgage
$78,565
Interest Rate
5.92%
Mortgage Type
Fannie Mae Freddie Mac
Purchase Details
Closed on
Oct 23, 2003
Sold by
Alonzo Cathi M and Alonzo Gregg A
Bought by
Ba Mortgage Llc
Create a Home Valuation Report for This Property
The Home Valuation Report is an in-depth analysis detailing your home's value as well as a comparison with similar homes in the area
Home Values in the Area
Average Home Value in this Area
Purchase History
| Date | Buyer | Sale Price | Title Company |
|---|---|---|---|
| Witmer Dane | -- | Stewart Title Company | |
| Federal National Mortgage Association | -- | None Available | |
| Johnson Dale Alan | -- | -- | |
| Ba Mortgage Llc | $88,130 | -- |
Source: Public Records
Mortgage History
| Date | Status | Borrower | Loan Amount |
|---|---|---|---|
| Open | Witmer Dane | $229,591 | |
| Previous Owner | Johnson Dale Alan | $78,565 |
Source: Public Records
Tax History Compared to Growth
Tax History
| Year | Tax Paid | Tax Assessment Tax Assessment Total Assessment is a certain percentage of the fair market value that is determined by local assessors to be the total taxable value of land and additions on the property. | Land | Improvement |
|---|---|---|---|---|
| 2025 | $3,928 | $561,721 | $200,000 | $361,721 |
| 2024 | $3,934 | $555,867 | $190,000 | $365,867 |
| 2023 | $3,934 | $560,013 | $190,000 | $370,013 |
| 2022 | $4,125 | $472,233 | $160,000 | $312,233 |
| 2021 | $3,911 | $399,633 | $125,000 | $274,633 |
| 2020 | $3,630 | $377,758 | $110,000 | $267,758 |
| 2019 | $3,143 | $353,196 | $150,000 | $203,196 |
| 2018 | $2,986 | $333,758 | $130,000 | $203,758 |
| 2017 | $2,792 | $279,884 | $75,000 | $204,884 |
| 2016 | $2,916 | $279,884 | $75,000 | $204,884 |
| 2015 | $2,972 | $282,136 | $75,000 | $207,136 |
| 2013 | -- | $283,890 | $72,250 | $211,640 |
Source: Public Records
Map
Nearby Homes
- 4750 Koontz Ranch Ln
- 4357 Hunter Ln
- 0 W Henni Rd
- 4340 Hamilton Dr
- 486 W Henni Rd
- 5175 Ridgeline Place
- 4318 Rhododendron Dr
- 285 Cornet Bay Rd
- 4374 Northgate Dr
- 4325 Northgate Dr
- 4515 Sunday Dr
- 4281 Northgate Dr
- 4261 Northgate Dr
- 4904 Deception Cir
- 0 N Norris Ln Unit NWM2429954
- 342 Frost Ln
- 634 Littlerock Ct
- 5002 Deception Cir
- 0 Monkey Hill Rd
- 4600 Jones Rd
- 85 E Troxell Rd
- 85 W Troxell Rd
- 4576 Mermaid Ln
- 4611 Park Acres Dr
- 4607 Park Acres Dr
- 4595 Alamo Way
- 4585 Alamo Way
- 4634 Felix Ln
- 4566 Mermaid Ln
- 4575 Alamo Way
- 67 Tear Drop Place
- 4615 Park Acres Dr
- 4615 Park Acres Dr
- 4563 Siesta Place
- 4594 Alamo Way
- 4565 Alamo Way
- 4553 Siesta Place
- 4576 Alamo Way
- 59 Tear Drop Place
- 4521 Siesta Place