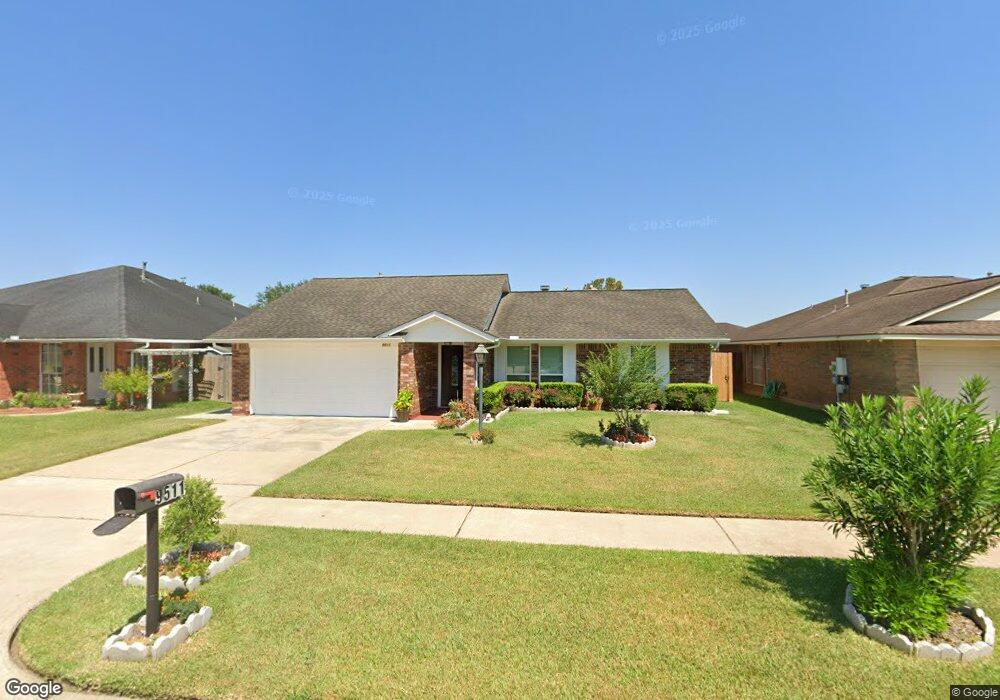
9511 Carmalee St Houston, TX 77075
Southbelt-Ellington NeighborhoodEstimated Value: $254,582 - $268,000
3
Beds
2
Baths
1,490
Sq Ft
$175/Sq Ft
Est. Value
About This Home
This home is located at 9511 Carmalee St, Houston, TX 77075 and is currently estimated at $260,396, approximately $174 per square foot. 9511 Carmalee St is a home located in Harris County with nearby schools including Atkinson Elementary School, Morris Middle School, and Beverly Hill Intermediate School.
Ownership History
Date
Name
Owned For
Owner Type
Purchase Details
Closed on
Jul 13, 2006
Sold by
Mustapha Abdool Momin and Mustapha Khateja
Bought by
Mustapha Emran and Mustapha Bibi Fazia
Current Estimated Value
Purchase Details
Closed on
Mar 27, 1997
Sold by
Larkstone Building Company
Bought by
Mustapha Abdool Momin and Mustapha Khateja
Home Financials for this Owner
Home Financials are based on the most recent Mortgage that was taken out on this home.
Original Mortgage
$77,607
Interest Rate
7.65%
Mortgage Type
FHA
Purchase Details
Closed on
Feb 12, 1997
Sold by
Parkstone Building Company
Bought by
Larkstone Building Company
Home Financials for this Owner
Home Financials are based on the most recent Mortgage that was taken out on this home.
Original Mortgage
$77,607
Interest Rate
7.65%
Mortgage Type
FHA
Create a Home Valuation Report for This Property
The Home Valuation Report is an in-depth analysis detailing your home's value as well as a comparison with similar homes in the area
Home Values in the Area
Average Home Value in this Area
Purchase History
| Date | Buyer | Sale Price | Title Company |
|---|---|---|---|
| Mustapha Emran | -- | None Available | |
| Mustapha Abdool Momin | -- | Commonwealth Land Title Co | |
| Larkstone Building Company | -- | Commonwealth Land Title Co |
Source: Public Records
Mortgage History
| Date | Status | Borrower | Loan Amount |
|---|---|---|---|
| Previous Owner | Mustapha Abdool Momin | $77,607 |
Source: Public Records
Tax History Compared to Growth
Tax History
| Year | Tax Paid | Tax Assessment Tax Assessment Total Assessment is a certain percentage of the fair market value that is determined by local assessors to be the total taxable value of land and additions on the property. | Land | Improvement |
|---|---|---|---|---|
| 2025 | $4,030 | $258,462 | $51,584 | $206,878 |
| 2024 | $4,030 | $244,186 | $42,557 | $201,629 |
| 2023 | $4,030 | $241,000 | $42,557 | $198,443 |
| 2022 | $5,903 | $240,393 | $42,557 | $197,836 |
| 2021 | $5,631 | $210,032 | $42,557 | $167,475 |
| 2020 | $5,223 | $190,552 | $38,688 | $151,864 |
| 2019 | $5,205 | $186,378 | $35,464 | $150,914 |
| 2018 | $1,892 | $164,141 | $27,404 | $136,737 |
| 2017 | $4,226 | $159,191 | $27,404 | $131,787 |
| 2016 | $3,842 | $139,491 | $22,568 | $116,923 |
| 2015 | $2,603 | $129,737 | $22,568 | $107,169 |
| 2014 | $2,603 | $119,426 | $22,568 | $96,858 |
Source: Public Records
Map
Nearby Homes
- 9411 Kingsvalley St
- 9407 Kingspass St
- 9303 Kingsflower Cir
- 9115 Kingsrose Ln
- 10906 Stover St
- 9423 Garden Bridge St
- 11019 Cayman Mist Dr
- 10831 Cayman Mist Dr
- 8723 Kirkmont Dr
- 10610 Stover St
- 9610 Sumerlin St
- 9602 Sumerlin St
- 9711 Ebb St
- 10827 Linden Gate Dr
- 9721 Foredale St
- 10918 Linden Gate Dr
- 9914 Sumerlin St
- 8706 Kirkmont Dr
- 10018 Ramey St
- 9039 Kirkland Dr
- 9515 Carmalee St
- 9507 Carmalee St
- 9510 Coast Bridge St
- 9519 Carmalee St
- 9503 Carmalee St
- 9514 Coast Bridge St
- 9506 Coast Bridge St
- 9518 Coast Bridge St
- 9502 Coast Bridge St
- 9510 Carmalee St
- 9506 Carmalee St
- 9514 Carmalee St
- 9523 Carmalee St
- 9495 Carmalee St
- 9502 Carmalee St
- 9518 Carmalee St
- 9522 Coast Bridge St
- 9482 Coast Bridge St
- 9527 Carmalee St
- 9491 Carmalee St