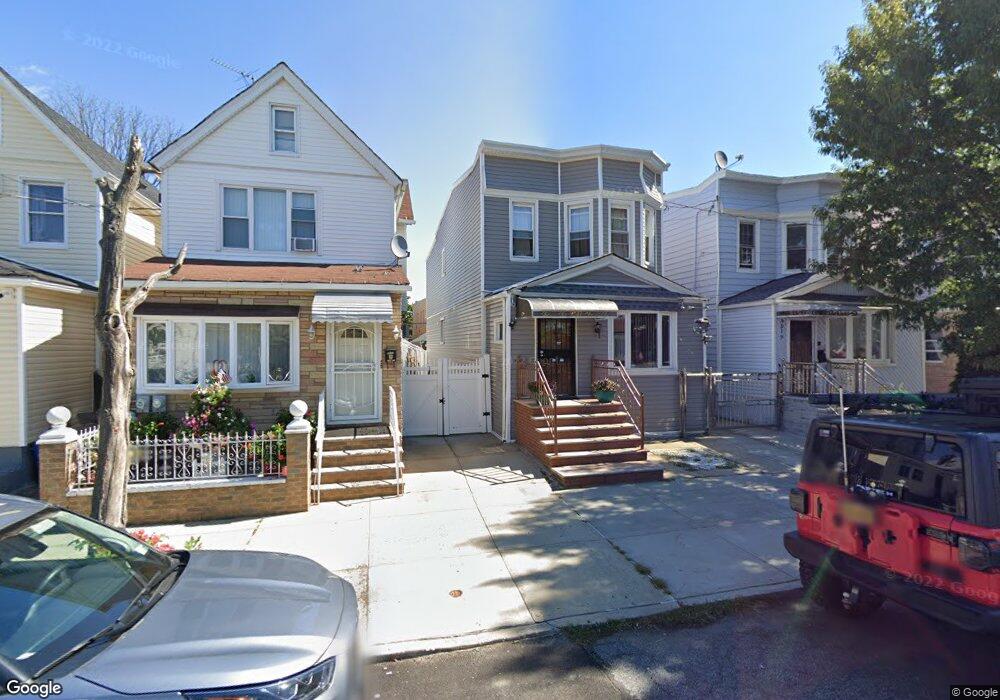
9517 109th St South Richmond Hill, NY 11419
Richmond Hill NeighborhoodEstimated Value: $802,000 - $900,000
--
Bed
--
Bath
1,608
Sq Ft
$531/Sq Ft
Est. Value
About This Home
This home is located at 9517 109th St, South Richmond Hill, NY 11419 and is currently estimated at $854,144, approximately $531 per square foot. 9517 109th St is a home located in Queens County with nearby schools including P.S. 62 - Chester Park, M.S.137 America's School of Heroes, and Richmond Hill High School.
Ownership History
Date
Name
Owned For
Owner Type
Purchase Details
Closed on
Sep 10, 2014
Sold by
Calogero Cipriano As Sole Surviving Heir At Law
Bought by
Khamoo Maiwantie and Somwaru Raymanand
Current Estimated Value
Home Financials for this Owner
Home Financials are based on the most recent Mortgage that was taken out on this home.
Original Mortgage
$432,250
Interest Rate
4.21%
Mortgage Type
New Conventional
Purchase Details
Closed on
Jun 26, 2002
Sold by
Ruggieri Antonio and Ruggieri Josephine
Bought by
Ruggieri Antonio and Ruggieri Josephine
Create a Home Valuation Report for This Property
The Home Valuation Report is an in-depth analysis detailing your home's value as well as a comparison with similar homes in the area
Home Values in the Area
Average Home Value in this Area
Purchase History
| Date | Buyer | Sale Price | Title Company |
|---|---|---|---|
| Khamoo Maiwantie | $455,000 | -- | |
| Ruggieri Antonio | -- | -- |
Source: Public Records
Mortgage History
| Date | Status | Borrower | Loan Amount |
|---|---|---|---|
| Previous Owner | Khamoo Maiwantie | $432,250 |
Source: Public Records
Tax History Compared to Growth
Tax History
| Year | Tax Paid | Tax Assessment Tax Assessment Total Assessment is a certain percentage of the fair market value that is determined by local assessors to be the total taxable value of land and additions on the property. | Land | Improvement |
|---|---|---|---|---|
| 2025 | $6,421 | $33,886 | $9,491 | $24,395 |
| 2024 | $6,421 | $31,968 | $9,692 | $22,276 |
| 2023 | $6,421 | $31,968 | $10,166 | $21,802 |
| 2022 | $4,620 | $45,180 | $13,680 | $31,500 |
| 2021 | $6,299 | $41,700 | $13,680 | $28,020 |
| 2020 | $5,977 | $35,880 | $13,680 | $22,200 |
| 2019 | $5,573 | $33,300 | $13,680 | $19,620 |
| 2018 | $5,241 | $26,640 | $12,549 | $14,091 |
| 2017 | $5,241 | $25,712 | $11,701 | $14,011 |
| 2016 | $4,986 | $25,712 | $11,701 | $14,011 |
| 2015 | $2,926 | $23,532 | $13,409 | $10,123 |
Source: Public Records
Map
Nearby Homes