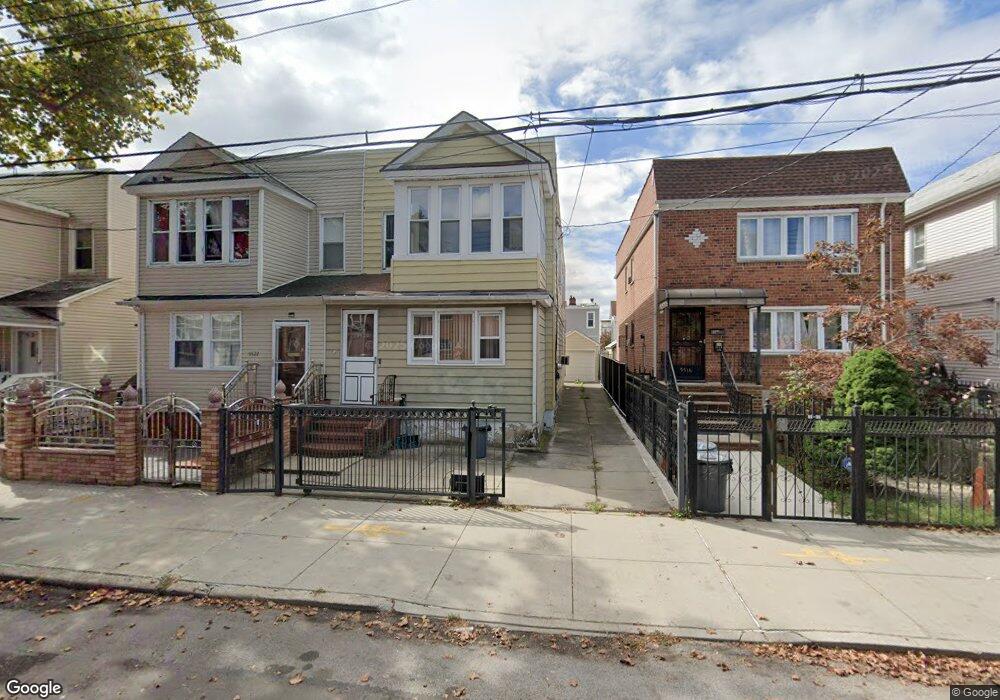
9520 110th St South Richmond Hill, NY 11419
Richmond Hill NeighborhoodEstimated Value: $868,000 - $998,000
--
Bed
--
Bath
1,980
Sq Ft
$473/Sq Ft
Est. Value
About This Home
This home is located at 9520 110th St, South Richmond Hill, NY 11419 and is currently estimated at $936,448, approximately $472 per square foot. 9520 110th St is a home located in Queens County with nearby schools including P.S. 62 - Chester Park, M.S.137 America's School of Heroes, and Richmond Hill High School.
Ownership History
Date
Name
Owned For
Owner Type
Purchase Details
Closed on
May 9, 2023
Sold by
Franzese Frank
Bought by
Franzese Joseph
Current Estimated Value
Home Financials for this Owner
Home Financials are based on the most recent Mortgage that was taken out on this home.
Original Mortgage
$313,500
Interest Rate
6.28%
Mortgage Type
Purchase Money Mortgage
Create a Home Valuation Report for This Property
The Home Valuation Report is an in-depth analysis detailing your home's value as well as a comparison with similar homes in the area
Home Values in the Area
Average Home Value in this Area
Purchase History
| Date | Buyer | Sale Price | Title Company |
|---|---|---|---|
| Franzese Joseph | $300,000 | -- |
Source: Public Records
Mortgage History
| Date | Status | Borrower | Loan Amount |
|---|---|---|---|
| Closed | Franzese Joseph | $313,500 |
Source: Public Records
Tax History Compared to Growth
Tax History
| Year | Tax Paid | Tax Assessment Tax Assessment Total Assessment is a certain percentage of the fair market value that is determined by local assessors to be the total taxable value of land and additions on the property. | Land | Improvement |
|---|---|---|---|---|
| 2025 | $7,202 | $38,007 | $10,697 | $27,310 |
| 2024 | $7,202 | $35,856 | $11,020 | $24,836 |
| 2023 | $6,822 | $33,967 | $11,541 | $22,426 |
| 2022 | $4,798 | $48,960 | $15,840 | $33,120 |
| 2021 | $6,449 | $44,880 | $15,840 | $29,040 |
| 2020 | $6,408 | $43,080 | $15,840 | $27,240 |
| 2019 | $5,958 | $41,400 | $15,840 | $25,560 |
| 2018 | $5,473 | $28,306 | $13,686 | $14,620 |
| 2017 | $5,145 | $26,707 | $13,585 | $13,122 |
| 2016 | $5,029 | $26,707 | $13,585 | $13,122 |
| 2015 | $2,819 | $26,394 | $15,529 | $10,865 |
| 2014 | $2,819 | $24,900 | $17,580 | $7,320 |
Source: Public Records
Map
Nearby Homes