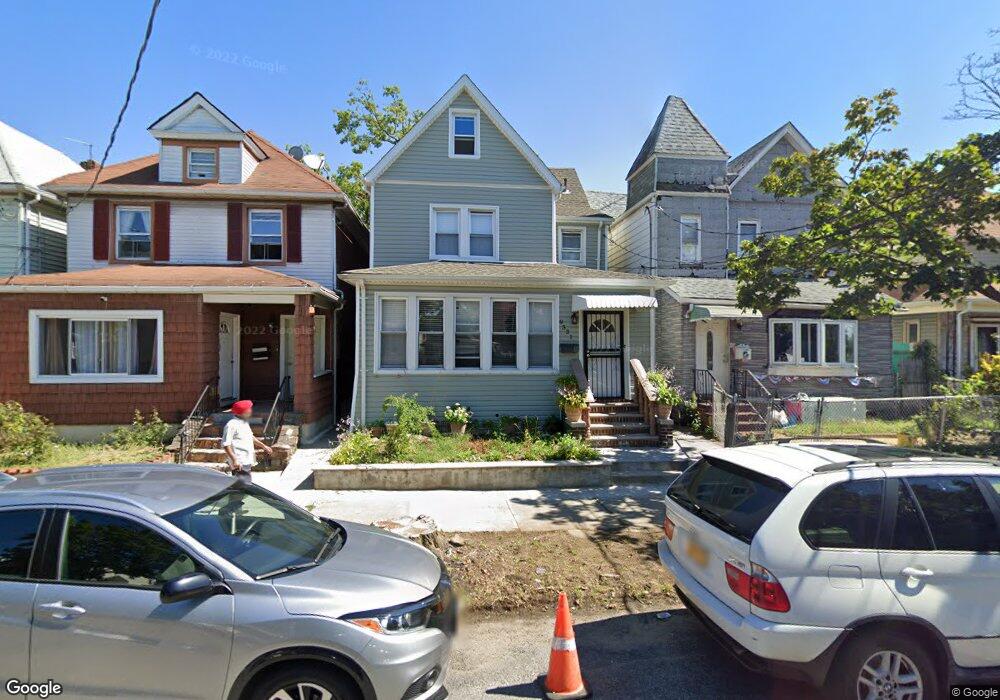
9531 109th St South Richmond Hill, NY 11419
Richmond Hill NeighborhoodEstimated Value: $708,000 - $813,000
--
Bed
--
Bath
1,849
Sq Ft
$403/Sq Ft
Est. Value
About This Home
This home is located at 9531 109th St, South Richmond Hill, NY 11419 and is currently estimated at $744,829, approximately $402 per square foot. 9531 109th St is a home located in Queens County with nearby schools including P.S. 62 - Chester Park, M.S.137 America's School of Heroes, and Richmond Hill High School.
Ownership History
Date
Name
Owned For
Owner Type
Purchase Details
Closed on
Sep 29, 2021
Sold by
Mariscal Jeanette
Bought by
Kumari Fnu Kamlesh and Kumari Fnu Rajinder
Current Estimated Value
Home Financials for this Owner
Home Financials are based on the most recent Mortgage that was taken out on this home.
Original Mortgage
$558,000
Outstanding Balance
$508,844
Interest Rate
2.8%
Mortgage Type
Purchase Money Mortgage
Estimated Equity
$235,985
Purchase Details
Closed on
Feb 13, 2002
Sold by
Mariscal Jose
Bought by
Mariscal Jose and Mariscal Jeannette
Home Financials for this Owner
Home Financials are based on the most recent Mortgage that was taken out on this home.
Original Mortgage
$198,400
Interest Rate
6.91%
Purchase Details
Closed on
Nov 7, 1997
Sold by
Tillman Roberta S and Leszczynski Helen
Bought by
Rivera Miguel and Rivera Aimee
Create a Home Valuation Report for This Property
The Home Valuation Report is an in-depth analysis detailing your home's value as well as a comparison with similar homes in the area
Home Values in the Area
Average Home Value in this Area
Purchase History
| Date | Buyer | Sale Price | Title Company |
|---|---|---|---|
| Kumari Fnu Kamlesh | $620,000 | -- | |
| Mariscal Jose | -- | -- | |
| Mariscal Jose | -- | -- | |
| Rivera Miguel | $135,500 | American Title Ins Co |
Source: Public Records
Mortgage History
| Date | Status | Borrower | Loan Amount |
|---|---|---|---|
| Open | Kumari Fnu Kamlesh | $558,000 | |
| Previous Owner | Mariscal Jose | $198,400 |
Source: Public Records
Tax History Compared to Growth
Tax History
| Year | Tax Paid | Tax Assessment Tax Assessment Total Assessment is a certain percentage of the fair market value that is determined by local assessors to be the total taxable value of land and additions on the property. | Land | Improvement |
|---|---|---|---|---|
| 2025 | $5,008 | $26,369 | $8,553 | $17,816 |
| 2024 | $5,008 | $24,936 | $9,390 | $15,546 |
| 2023 | $4,749 | $23,645 | $8,405 | $15,240 |
| 2022 | $4,463 | $42,720 | $14,460 | $28,260 |
| 2021 | $4,409 | $45,600 | $14,460 | $31,140 |
| 2020 | $4,355 | $40,440 | $14,460 | $25,980 |
| 2019 | $4,054 | $34,620 | $14,460 | $20,160 |
| 2018 | $3,719 | $19,704 | $9,852 | $9,852 |
| 2017 | $3,498 | $18,630 | $9,296 | $9,334 |
| 2016 | $3,414 | $18,630 | $9,296 | $9,334 |
| 2015 | $1,900 | $18,312 | $10,930 | $7,382 |
| 2014 | $1,900 | $17,317 | $10,290 | $7,027 |
Source: Public Records
Map
Nearby Homes