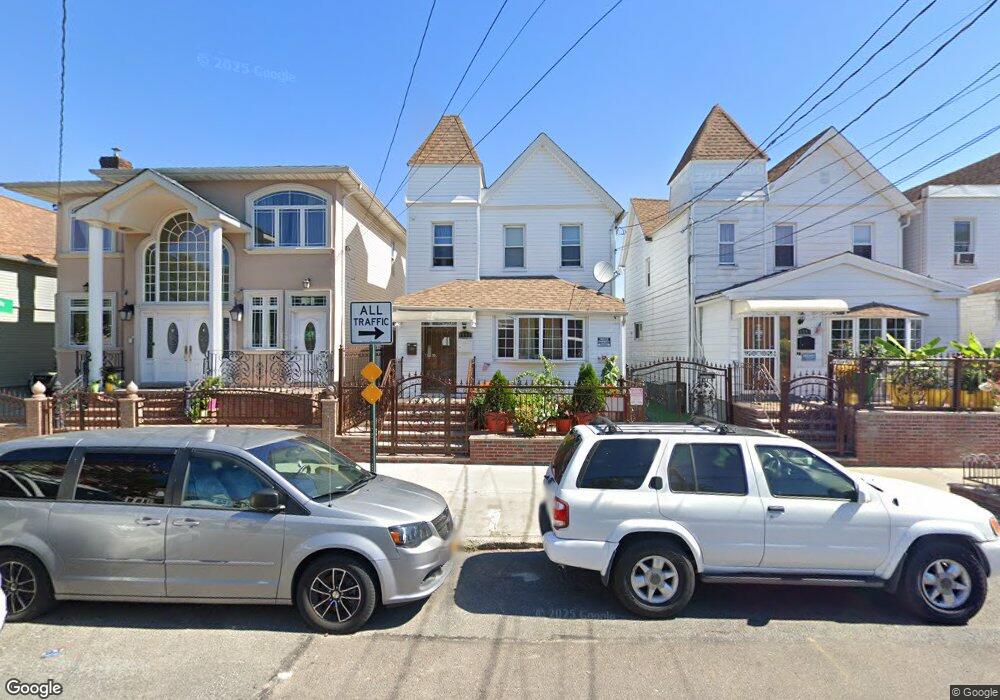
9543 109th St South Richmond Hill, NY 11419
Richmond Hill NeighborhoodEstimated Value: $625,925 - $787,000
--
Bed
--
Bath
1,280
Sq Ft
$566/Sq Ft
Est. Value
About This Home
This home is located at 9543 109th St, South Richmond Hill, NY 11419 and is currently estimated at $723,981, approximately $565 per square foot. 9543 109th St is a home located in Queens County with nearby schools including P.S. 62 - Chester Park, M.S.137 America's School of Heroes, and Richmond Hill High School.
Ownership History
Date
Name
Owned For
Owner Type
Purchase Details
Closed on
Dec 15, 2021
Sold by
Khan Natilia Sasha and Khan Shaw Ryan
Bought by
95-43 109 Street Inc
Current Estimated Value
Purchase Details
Closed on
Apr 6, 2019
Sold by
Khan Shaw Ryan
Bought by
Khan Natilia Sasha and Khan Shaw Ryan
Purchase Details
Closed on
May 18, 2016
Sold by
Khan Camille and Khan Shaw M
Bought by
Khan Shaw Ryan
Purchase Details
Closed on
Sep 6, 2013
Sold by
Teng Barbara and Teng Kuang H
Bought by
Khan Camille and Khan Shaw M
Create a Home Valuation Report for This Property
The Home Valuation Report is an in-depth analysis detailing your home's value as well as a comparison with similar homes in the area
Home Values in the Area
Average Home Value in this Area
Purchase History
| Date | Buyer | Sale Price | Title Company |
|---|---|---|---|
| 95-43 109 Street Inc | -- | -- | |
| Khan Natilia Sasha | -- | -- | |
| Khan Shaw Ryan | -- | -- | |
| Khan Camille | $400,000 | -- |
Source: Public Records
Tax History Compared to Growth
Tax History
| Year | Tax Paid | Tax Assessment Tax Assessment Total Assessment is a certain percentage of the fair market value that is determined by local assessors to be the total taxable value of land and additions on the property. | Land | Improvement |
|---|---|---|---|---|
| 2025 | $6,099 | $32,048 | $9,873 | $22,175 |
| 2024 | $6,099 | $30,366 | $10,067 | $20,299 |
| 2023 | $5,832 | $28,714 | $8,109 | $20,605 |
| 2022 | $5,473 | $40,860 | $10,980 | $29,880 |
| 2021 | $5,621 | $38,400 | $10,980 | $27,420 |
| 2020 | $5,653 | $33,000 | $10,980 | $22,020 |
| 2019 | $5,294 | $35,880 | $10,980 | $24,900 |
| 2018 | $4,878 | $23,928 | $9,356 | $14,572 |
| 2017 | $4,658 | $22,848 | $9,031 | $13,817 |
| 2016 | $4,289 | $22,848 | $9,031 | $13,817 |
| 2015 | $2,271 | $21,456 | $10,971 | $10,485 |
| 2014 | $2,271 | $20,288 | $11,937 | $8,351 |
Source: Public Records
Map
Nearby Homes