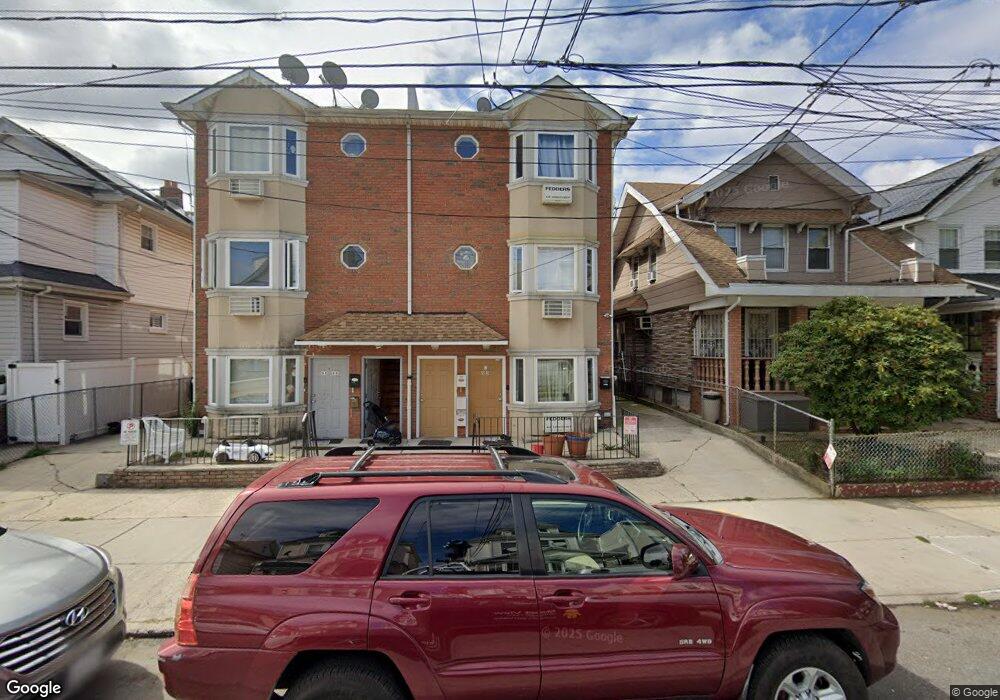
9546 110th St South Richmond Hill, NY 11419
Richmond Hill NeighborhoodEstimated Value: $1,313,000 - $1,485,000
--
Bed
--
Bath
3,009
Sq Ft
$468/Sq Ft
Est. Value
About This Home
This home is located at 9546 110th St, South Richmond Hill, NY 11419 and is currently estimated at $1,409,000, approximately $468 per square foot. 9546 110th St is a home located in Queens County with nearby schools including P.S. 62 - Chester Park, M.S.137 America's School of Heroes, and Richmond Hill High School.
Ownership History
Date
Name
Owned For
Owner Type
Purchase Details
Closed on
Sep 12, 2017
Sold by
Motilal Karen
Bought by
Motilal Hardath and Motilal Karen
Current Estimated Value
Purchase Details
Closed on
Jul 14, 2010
Sold by
Motilal Hardath and Motilal Karen
Bought by
Motilal Karen
Purchase Details
Closed on
Jul 5, 2006
Sold by
Khamco Llc
Bought by
Motilal Hardath and Motilal Karen
Purchase Details
Closed on
Mar 18, 2005
Sold by
Motilal Hardath and Motilal Karen
Bought by
Khamco Llc
Purchase Details
Closed on
Jul 10, 1998
Sold by
Khan Emamodin M and Khan Gaitrie
Bought by
Motilal Hardath and Motilal Karen
Home Financials for this Owner
Home Financials are based on the most recent Mortgage that was taken out on this home.
Original Mortgage
$236,550
Interest Rate
6.94%
Create a Home Valuation Report for This Property
The Home Valuation Report is an in-depth analysis detailing your home's value as well as a comparison with similar homes in the area
Home Values in the Area
Average Home Value in this Area
Purchase History
| Date | Buyer | Sale Price | Title Company |
|---|---|---|---|
| Motilal Hardath | $390,000 | -- | |
| Motilal Hardath | $390,000 | -- | |
| Motilal Hardath | $390,000 | -- | |
| Motilal Karen | $396,000 | -- | |
| Motilal Karen | $396,000 | -- | |
| Motilal Hardath | -- | -- | |
| Motilal Hardath | -- | -- | |
| Khamco Llc | $750,000 | -- | |
| Khamco Llc | $750,000 | -- | |
| Motilal Hardath | $249,000 | First American Title Ins Co | |
| Motilal Hardath | $249,000 | First American Title Ins Co |
Source: Public Records
Mortgage History
| Date | Status | Borrower | Loan Amount |
|---|---|---|---|
| Previous Owner | Motilal Hardath | $236,550 |
Source: Public Records
Tax History Compared to Growth
Tax History
| Year | Tax Paid | Tax Assessment Tax Assessment Total Assessment is a certain percentage of the fair market value that is determined by local assessors to be the total taxable value of land and additions on the property. | Land | Improvement |
|---|---|---|---|---|
| 2025 | $8,121 | $42,860 | $12,344 | $30,516 |
| 2024 | $8,121 | $40,435 | $13,355 | $27,080 |
| 2023 | $8,121 | $40,435 | $14,078 | $26,357 |
| 2022 | $8,011 | $65,160 | $21,600 | $43,560 |
| 2021 | $6,813 | $54,000 | $21,600 | $32,400 |
| 2020 | $4,363 | $57,240 | $21,600 | $35,640 |
| 2019 | $4,129 | $59,340 | $21,600 | $37,740 |
| 2018 | $3,075 | $33,696 | $15,492 | $18,204 |
| 2017 | $2,126 | $33,441 | $16,357 | $17,084 |
| 2016 | $2,085 | $33,441 | $16,357 | $17,084 |
| 2015 | $1,424 | $29,764 | $21,184 | $8,580 |
| 2014 | $1,424 | $28,080 | $24,000 | $4,080 |
Source: Public Records
Map
Nearby Homes
- 9546 110th St Unit 1st Fl
- 9548 110th St
- 9544 110th St
- 9550 110th St
- 95-46 110th St Unit 2nd Fl
- 95-46 110th St Unit 1st Fl
- 95-46 110th St
- 9536 110th St
- 95-52 110th St
- 9552 110th St
- 9534 110th St
- 9554 110th St
- 9532 110th St
- 9543 109th St
- 9541 109th St
- 9701 109th St
- 9702 110th St
- 9535 109th St
- 9705 109th St
- 9530 110th St