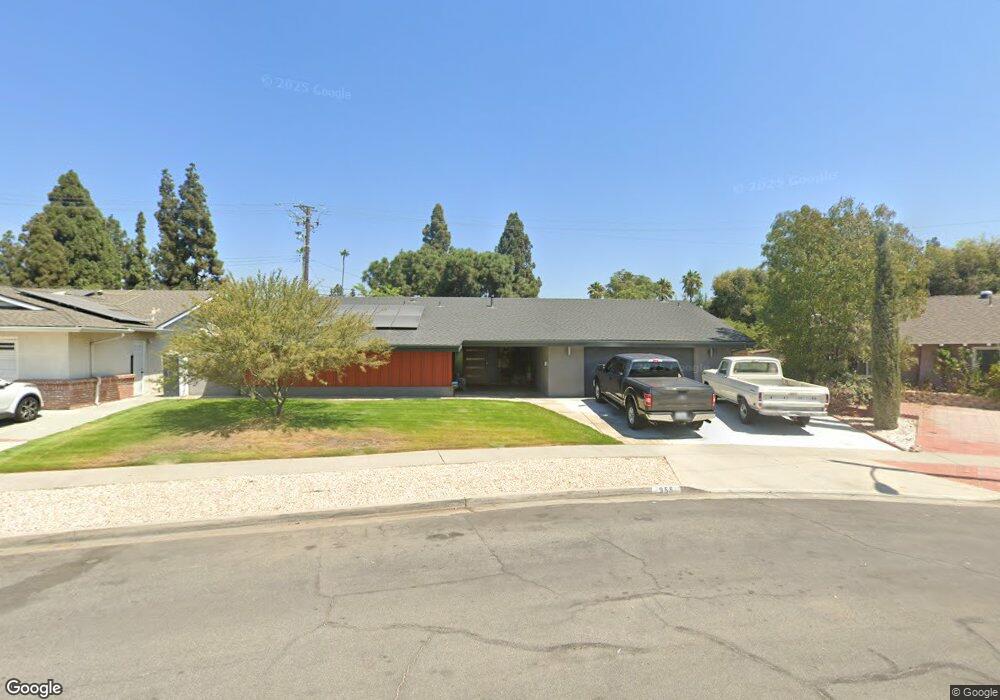
955 Kingswood Dr Placentia, CA 92870
Estimated Value: $1,148,000 - $1,200,000
4
Beds
3
Baths
2,107
Sq Ft
$562/Sq Ft
Est. Value
About This Home
This home is located at 955 Kingswood Dr, Placentia, CA 92870 and is currently estimated at $1,184,809, approximately $562 per square foot. 955 Kingswood Dr is a home located in Orange County with nearby schools including Wagner Elementary School, Col. J. K. Tuffree Middle School, and El Dorado High School.
Ownership History
Date
Name
Owned For
Owner Type
Purchase Details
Closed on
Sep 28, 2020
Sold by
Black Anne C and Black Richard James
Bought by
Black Anne C and Anne C Black Trust
Current Estimated Value
Home Financials for this Owner
Home Financials are based on the most recent Mortgage that was taken out on this home.
Original Mortgage
$445,500
Outstanding Balance
$395,526
Interest Rate
2.8%
Mortgage Type
New Conventional
Estimated Equity
$789,283
Purchase Details
Closed on
May 20, 2020
Sold by
Black Amber Marie
Bought by
Black Richard
Home Financials for this Owner
Home Financials are based on the most recent Mortgage that was taken out on this home.
Original Mortgage
$439,000
Interest Rate
3.3%
Mortgage Type
New Conventional
Purchase Details
Closed on
May 14, 2020
Sold by
Black Anne C and Black Richard
Bought by
Black Anne C and Black Richard James
Home Financials for this Owner
Home Financials are based on the most recent Mortgage that was taken out on this home.
Original Mortgage
$439,000
Interest Rate
3.3%
Mortgage Type
New Conventional
Purchase Details
Closed on
Oct 24, 2018
Sold by
Black Anne C and Black Richard
Bought by
Black Anne C and Anne C Black Trust
Purchase Details
Closed on
Jun 2, 2015
Sold by
Black Amber Marie
Bought by
Black Richard
Home Financials for this Owner
Home Financials are based on the most recent Mortgage that was taken out on this home.
Original Mortgage
$476,000
Interest Rate
3.81%
Mortgage Type
New Conventional
Purchase Details
Closed on
May 27, 2015
Sold by
Black Anne C
Bought by
Black Anne C and Black Richard
Home Financials for this Owner
Home Financials are based on the most recent Mortgage that was taken out on this home.
Original Mortgage
$476,000
Interest Rate
3.81%
Mortgage Type
New Conventional
Purchase Details
Closed on
Jul 12, 2010
Sold by
Black Anne C
Bought by
Black Anne C and The Anne C Black Separate Property Trust
Purchase Details
Closed on
Nov 11, 2001
Sold by
Jones Randolph A and Black Anne C
Bought by
Jones Randolph A and Black Anne C
Home Financials for this Owner
Home Financials are based on the most recent Mortgage that was taken out on this home.
Original Mortgage
$256,750
Interest Rate
6.63%
Purchase Details
Closed on
Sep 17, 1998
Sold by
Myrna Quinones
Bought by
Jones Randolph A and Black Anne C
Home Financials for this Owner
Home Financials are based on the most recent Mortgage that was taken out on this home.
Original Mortgage
$206,400
Interest Rate
6.6%
Create a Home Valuation Report for This Property
The Home Valuation Report is an in-depth analysis detailing your home's value as well as a comparison with similar homes in the area
Home Values in the Area
Average Home Value in this Area
Purchase History
| Date | Buyer | Sale Price | Title Company |
|---|---|---|---|
| Black Anne C | -- | Lawyers Title Sd | |
| Black Anne C | -- | Lawyers Title Sd | |
| Black Richard James | -- | Lawyers Title Sd | |
| Black Richard | -- | Lawyers Title Sd | |
| Black Anne C | -- | Lawyers Title | |
| Black Anne C | -- | Lawyers Title Sd | |
| Black Anne C | -- | None Available | |
| Black Richard | -- | Entitle Insurance Company | |
| Black Anne C | -- | Entitle Insurance Company | |
| Black Anne C | -- | None Available | |
| Jones Randolph A | -- | Fidelity National Title | |
| Jones Randolph A | $258,000 | Landwood Title Company | |
| Quinones Myrna | -- | Landwood Title Company |
Source: Public Records
Mortgage History
| Date | Status | Borrower | Loan Amount |
|---|---|---|---|
| Open | Black Anne C | $445,500 | |
| Closed | Black Anne C | $439,000 | |
| Closed | Black Anne C | $476,000 | |
| Closed | Jones Randolph A | $256,750 | |
| Previous Owner | Jones Randolph A | $206,400 |
Source: Public Records
Tax History Compared to Growth
Tax History
| Year | Tax Paid | Tax Assessment Tax Assessment Total Assessment is a certain percentage of the fair market value that is determined by local assessors to be the total taxable value of land and additions on the property. | Land | Improvement |
|---|---|---|---|---|
| 2025 | $5,233 | $417,545 | $278,718 | $138,827 |
| 2024 | $5,233 | $409,358 | $273,253 | $136,105 |
| 2023 | $5,106 | $401,332 | $267,895 | $133,437 |
| 2022 | $5,008 | $393,463 | $262,642 | $130,821 |
| 2021 | $4,870 | $385,749 | $257,493 | $128,256 |
| 2020 | $4,891 | $381,794 | $254,853 | $126,941 |
| 2019 | $4,693 | $374,308 | $249,856 | $124,452 |
| 2018 | $4,555 | $366,969 | $244,957 | $122,012 |
| 2017 | $4,476 | $359,774 | $240,154 | $119,620 |
| 2016 | $4,386 | $352,720 | $235,445 | $117,275 |
| 2015 | $4,404 | $347,422 | $231,908 | $115,514 |
| 2014 | $4,282 | $340,617 | $227,365 | $113,252 |
Source: Public Records
Map
Nearby Homes
- 4882 Kermath St
- 4942 Gem Ln
- 16692 Meadowview Dr
- 1429 Prospect Ave Unit B
- 619 E Yorba Linda Blvd
- 4571 Mimosa Dr
- 4802 Brookway Ave
- 1261 Desoto St
- 4781 Kona Kove Way
- 1701 Shaw Cir
- 17001 La Kenice Way
- 11715 Rose Dr
- 943 Berkenstock Ln
- 439 Normandy Ave
- 719 Cobb Ave
- 421 Larry Ln
- 727 Olivier Dr
- 732 Olivier Dr
- 1837 Kelleher Place
- 726 Olivier Dr
- 949 Kingswood Dr
- 1438 Richmond Dr
- 943 Kingswood Dr
- 1432 Richmond Dr
- 1433 Richmond Dr
- 940 Kingswood Dr
- 937 Kingswood Dr
- 1426 Richmond Dr
- 1427 Richmond Dr
- 934 Kingswood Dr
- 1430 Shalanwood Ln
- 1421 Richmond Dr
- 1420 Richmond Dr
- 931 Kingswood Dr
- 1424 Shalanwood Ln
- 1415 Richmond Dr
- 1501 Canterbury Ct Unit 20
- 1501 Canterbury Ct Unit D
- 1501 Canterbury Ct Unit B
- 1501 Canterbury Ct Unit A