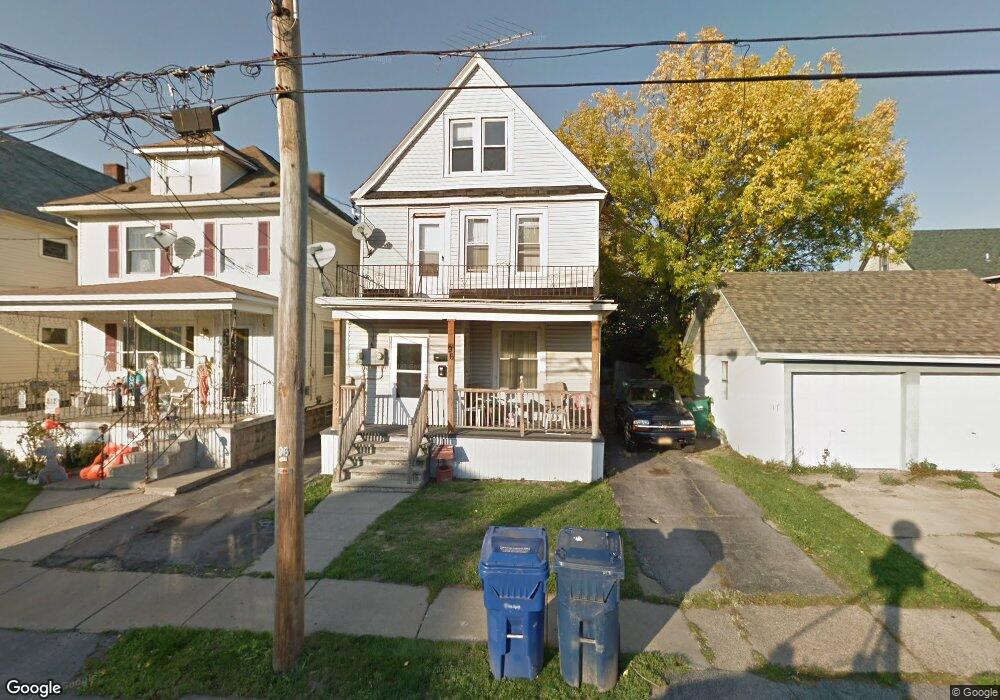
96 Philadelphia St Buffalo, NY 14207
Riverside NeighborhoodEstimated Value: $183,507 - $222,000
4
Beds
2
Baths
1,747
Sq Ft
$116/Sq Ft
Est. Value
About This Home
This home is located at 96 Philadelphia St, Buffalo, NY 14207 and is currently estimated at $202,627, approximately $115 per square foot. 96 Philadelphia St is a home located in Erie County with nearby schools including Charter School for Applied Technologies and St. Andrews Country Day School.
Ownership History
Date
Name
Owned For
Owner Type
Purchase Details
Closed on
Dec 21, 2024
Sold by
Cooke James E
Bought by
Cooke James E and Bliznik Denise
Current Estimated Value
Home Financials for this Owner
Home Financials are based on the most recent Mortgage that was taken out on this home.
Original Mortgage
$117,000
Outstanding Balance
$116,078
Interest Rate
6.78%
Mortgage Type
New Conventional
Estimated Equity
$86,549
Purchase Details
Closed on
Dec 1, 2005
Sold by
Seibold Michael L
Bought by
Cooke James E
Home Financials for this Owner
Home Financials are based on the most recent Mortgage that was taken out on this home.
Original Mortgage
$30,900
Interest Rate
6.34%
Mortgage Type
Purchase Money Mortgage
Purchase Details
Closed on
Dec 10, 1998
Create a Home Valuation Report for This Property
The Home Valuation Report is an in-depth analysis detailing your home's value as well as a comparison with similar homes in the area
Home Values in the Area
Average Home Value in this Area
Purchase History
| Date | Buyer | Sale Price | Title Company |
|---|---|---|---|
| Cooke James E | -- | None Available | |
| Cooke James E | -- | None Available | |
| Cooke James E | -- | None Available | |
| Cooke James E | $31,900 | None Available | |
| Cooke James E | $31,900 | None Available | |
| Cooke James E | $31,900 | None Available | |
| -- | $27,833 | -- | |
| -- | $27,833 | -- |
Source: Public Records
Mortgage History
| Date | Status | Borrower | Loan Amount |
|---|---|---|---|
| Open | Cooke James E | $117,000 | |
| Closed | Cooke James E | $117,000 | |
| Closed | Cooke James E | $30,900 |
Source: Public Records
Tax History Compared to Growth
Tax History
| Year | Tax Paid | Tax Assessment Tax Assessment Total Assessment is a certain percentage of the fair market value that is determined by local assessors to be the total taxable value of land and additions on the property. | Land | Improvement |
|---|---|---|---|---|
| 2024 | $437 | $78,000 | $5,000 | $73,000 |
| 2023 | $395 | $78,000 | $5,000 | $73,000 |
| 2022 | $392 | $78,000 | $5,000 | $73,000 |
| 2021 | $392 | $78,000 | $5,000 | $73,000 |
| 2020 | $385 | $78,000 | $5,000 | $73,000 |
| 2019 | $1,372 | $50,000 | $5,300 | $44,700 |
| 2018 | $1,291 | $50,000 | $5,300 | $44,700 |
| 2017 | $297 | $50,000 | $5,300 | $44,700 |
| 2016 | $901 | $50,000 | $5,300 | $44,700 |
| 2015 | -- | $50,000 | $5,300 | $44,700 |
| 2014 | -- | $50,000 | $5,300 | $44,700 |
Source: Public Records
Map
Nearby Homes
- 94 Philadelphia St
- 90 Philadelphia St
- 518 Ontario St
- 520 Ontario St
- 86 Philadelphia St
- 524 Ontario St
- 514 Ontario St
- 84 Philadelphia St
- 81 Evelyn St
- 79 Evelyn St
- 75 Evelyn St
- 530 Ontario St
- 73 Evelyn St
- 80 Philadelphia St
- 69 Evelyn St
- 78 Philadelphia St
- 67 Evelyn St
- 95 Philadelphia St
- 89 Philadelphia St
- 500 Ontario St