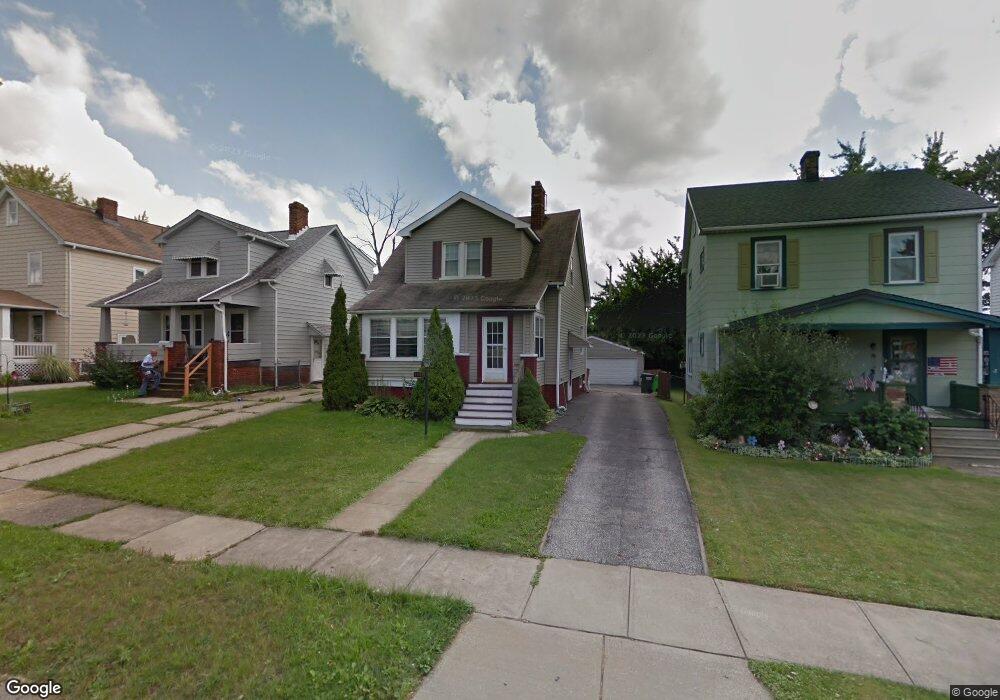
9608 Park Heights Ave Cleveland, OH 44125
Estimated Value: $116,480 - $136,000
3
Beds
1
Bath
972
Sq Ft
$131/Sq Ft
Est. Value
About This Home
This home is located at 9608 Park Heights Ave, Cleveland, OH 44125 and is currently estimated at $126,870, approximately $130 per square foot. 9608 Park Heights Ave is a home located in Cuyahoga County with nearby schools including Garfield Heights High School, North Shore High School, and Trinity High School.
Ownership History
Date
Name
Owned For
Owner Type
Purchase Details
Closed on
Nov 8, 2007
Sold by
Amtrust Bank
Bought by
Conwell Shaunte M
Current Estimated Value
Home Financials for this Owner
Home Financials are based on the most recent Mortgage that was taken out on this home.
Original Mortgage
$83,165
Outstanding Balance
$52,809
Interest Rate
6.45%
Mortgage Type
FHA
Estimated Equity
$74,061
Purchase Details
Closed on
Jan 3, 2007
Sold by
Jameson Paul and Jameson Mary Lou
Bought by
Ohio Savings Bank
Purchase Details
Closed on
Mar 15, 1989
Sold by
Horvath Carolyn D
Bought by
Jameson Paul R
Purchase Details
Closed on
Jul 7, 1987
Sold by
Horvath William J
Bought by
Horvath Carolyn D
Purchase Details
Closed on
Mar 16, 1978
Sold by
Galeti C A and P A
Bought by
Horvath William J
Purchase Details
Closed on
Jan 1, 1975
Bought by
Galeti C A and P A
Create a Home Valuation Report for This Property
The Home Valuation Report is an in-depth analysis detailing your home's value as well as a comparison with similar homes in the area
Home Values in the Area
Average Home Value in this Area
Purchase History
| Date | Buyer | Sale Price | Title Company |
|---|---|---|---|
| Conwell Shaunte M | $74,000 | Landamerica | |
| Ohio Savings Bank | -- | Us Title Agency | |
| Jameson Paul R | $45,500 | -- | |
| Horvath Carolyn D | -- | -- | |
| Horvath William J | $36,000 | -- | |
| Galeti C A | -- | -- |
Source: Public Records
Mortgage History
| Date | Status | Borrower | Loan Amount |
|---|---|---|---|
| Open | Conwell Shaunte M | $83,165 |
Source: Public Records
Tax History Compared to Growth
Tax History
| Year | Tax Paid | Tax Assessment Tax Assessment Total Assessment is a certain percentage of the fair market value that is determined by local assessors to be the total taxable value of land and additions on the property. | Land | Improvement |
|---|---|---|---|---|
| 2024 | $3,752 | $35,595 | $7,840 | $27,755 |
| 2023 | $3,017 | $26,430 | $5,740 | $20,690 |
| 2022 | $3,688 | $26,430 | $5,740 | $20,690 |
| 2021 | $3,145 | $26,430 | $5,740 | $20,690 |
| 2020 | $2,704 | $21,140 | $4,590 | $16,560 |
| 2019 | $2,681 | $60,400 | $13,100 | $47,300 |
| 2018 | $2,791 | $21,140 | $4,590 | $16,560 |
| 2017 | $2,707 | $20,020 | $3,640 | $16,380 |
| 2016 | $2,746 | $20,020 | $3,640 | $16,380 |
| 2015 | $3,021 | $20,020 | $3,640 | $16,380 |
| 2014 | $3,021 | $24,400 | $4,450 | $19,950 |
Source: Public Records
Map
Nearby Homes
- 9612 Park Heights Ave
- 9611 Mccracken Rd
- 9302 Park Heights Ave
- 10005 Park Heights Ave
- 9819 S Highland Ave
- 9513 David Rd
- 10016 Park Heights Ave
- 9011 Park Heights Ave
- 8827 Park Heights Ave
- 4969 E 90th St
- 4903 E 94th St
- 4932 E 93rd St
- 10100 Grace Ave
- 4963 E 88th St
- 4899 E 96th St
- 10501 Park Heights Ave
- 4883 E 96th St
- 10401 Grace Ave
- 4839 E 94th St
- 10408 S Highland Ave
- 9600 Park Heights Ave
- 9616 Park Heights Ave
- 9524 Park Heights Ave
- 9611 Mccracken Blvd
- 9607 Mccracken Blvd
- 9615 Mccracken Blvd
- 9603 Mccracken Blvd
- 9619 Mccracken Blvd
- 9624 Park Heights Ave
- 9527 Mccracken Blvd
- 9607 Park Heights Ave
- 9613 Park Heights Ave
- 9603 Park Heights Ave
- 9623 Mccracken Blvd
- 9623 Mccracken Rd
- 9523 Mccracken Blvd
- 9516 Park Heights Ave
- 9617 Park Heights Ave
- 9702 Park Heights Ave
- 9525 Park Heights Ave