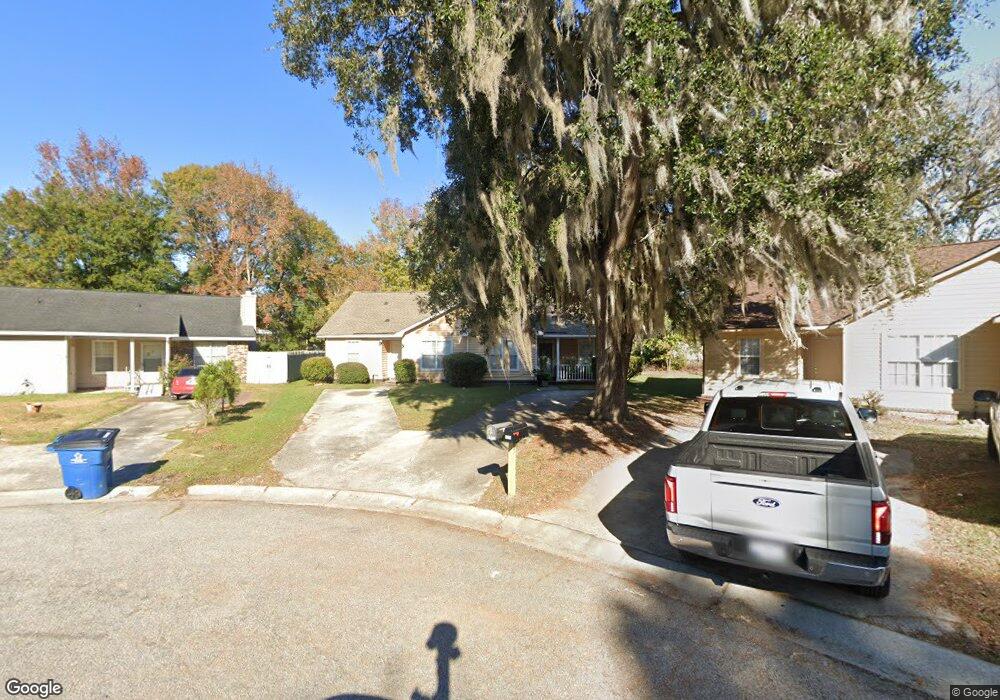
9610 Blue Jay Ct Unit 9612 Ladson, SC 29456
Estimated Value: $275,000 - $365,186
4
Beds
4
Baths
2,000
Sq Ft
$158/Sq Ft
Est. Value
About This Home
This home is located at 9610 Blue Jay Ct Unit 9612, Ladson, SC 29456 and is currently estimated at $316,797, approximately $158 per square foot. 9610 Blue Jay Ct Unit 9612 is a home located in Dorchester County with nearby schools including Joseph R. Pye Elementary, Oakbrook Middle School, and Ashley Ridge High School.
Ownership History
Date
Name
Owned For
Owner Type
Purchase Details
Closed on
Dec 28, 2023
Sold by
Brand Richard A and Brand Dawn M
Bought by
Brand Direct Properties Llc
Current Estimated Value
Purchase Details
Closed on
Oct 1, 2014
Sold by
White James A and White Darlene V
Bought by
Brand Richard A and Brand Dawn M
Home Financials for this Owner
Home Financials are based on the most recent Mortgage that was taken out on this home.
Original Mortgage
$95,250
Interest Rate
4.17%
Mortgage Type
New Conventional
Purchase Details
Closed on
Jul 17, 2006
Sold by
Bulwinkle Thomas D
Bought by
White James A and White Darlene
Home Financials for this Owner
Home Financials are based on the most recent Mortgage that was taken out on this home.
Original Mortgage
$116,250
Interest Rate
7.5%
Mortgage Type
Adjustable Rate Mortgage/ARM
Create a Home Valuation Report for This Property
The Home Valuation Report is an in-depth analysis detailing your home's value as well as a comparison with similar homes in the area
Home Values in the Area
Average Home Value in this Area
Purchase History
| Date | Buyer | Sale Price | Title Company |
|---|---|---|---|
| Brand Direct Properties Llc | -- | None Listed On Document | |
| Brand Richard A | $127,000 | -- | |
| White James A | $155,000 | None Available |
Source: Public Records
Mortgage History
| Date | Status | Borrower | Loan Amount |
|---|---|---|---|
| Previous Owner | Brand Richard A | $95,250 | |
| Previous Owner | White James A | $116,250 |
Source: Public Records
Tax History Compared to Growth
Tax History
| Year | Tax Paid | Tax Assessment Tax Assessment Total Assessment is a certain percentage of the fair market value that is determined by local assessors to be the total taxable value of land and additions on the property. | Land | Improvement |
|---|---|---|---|---|
| 2025 | $9,286 | $25,465 | $9,000 | $16,465 |
| 2024 | $9,286 | $25,465 | $9,000 | $16,465 |
| 2023 | $9,286 | $11,693 | $2,400 | $9,293 |
| 2022 | $3,451 | $8,760 | $2,070 | $6,690 |
| 2021 | $3,391 | $8,760 | $2,070 | $6,690 |
| 2020 | $3,243 | $7,620 | $1,800 | $5,820 |
| 2019 | $3,195 | $7,620 | $1,800 | $5,820 |
| 2018 | $2,725 | $7,620 | $1,800 | $5,820 |
| 2017 | $2,717 | $7,620 | $1,800 | $5,820 |
| 2016 | $2,676 | $7,620 | $1,800 | $5,820 |
| 2015 | $2,671 | $7,620 | $1,800 | $5,820 |
| 2014 | $2,767 | $134,090 | $0 | $0 |
| 2013 | -- | $8,050 | $0 | $0 |
Source: Public Records
Map
Nearby Homes
- 9612 Blue Jay Ct
- 4174 Hickory Ln
- 9512 Raven Dr
- 202 Oakmont Ave Unit A
- 203 Oakmont Ave Unit B
- 105 Hickory Ln Unit C
- 117 Spanish Oaks Ln
- 1035 Lexi Ct
- 108 Spanish Oaks Ln Unit 4703
- 165 Grand Oaks Dr Unit 1302
- 154 Grand Oaks Dr Unit 4102
- 1045 Lexi Ct
- 229 Grand Oaks Dr
- 181 Grand Oaks Dr Unit 1803
- 209 Grand Oaks Dr Unit 2102
- 108 Mickler Dr
- 1064 Lexi Ct
- 1076 Lexi Ct
- 9101 Parlor Dr
- 116 Robert Dr
- 9610 Blue Jay Ct
- 9608 Blue Jay Ct
- 9606 Blue Jay Ct
- 9614 Blue Jay Ct
- 9623 N Cardinal Dr
- 9625 N Cardinal Dr
- 9621 N Cardinal Dr Unit B
- 9621 N Cardinal Dr
- 9621 N Cardinal Dr Unit A/B
- 9621 N Cardinal Dr Unit A
- 9604 Blue Jay Ct
- 9613 Blue Jay Ct
- 9627 N Cardinal Dr
- 9602 Blue Jay Ct
- 4152 Hickory Ln
- 4162 Hickory Ln
- 4160 Hickory Ln
- 9629 N Cardinal Dr
- 9611 Blue Jay Ct
- 41324134 Hickory Ln