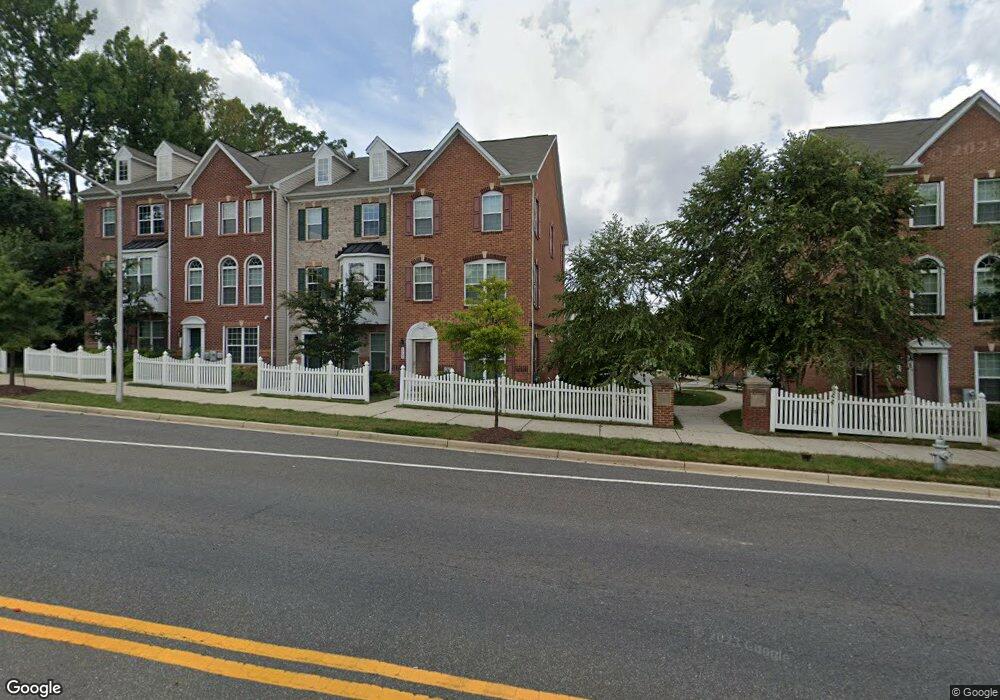
9613 Westerdale Dr Upper Marlboro, MD 20774
Estimated Value: $464,159 - $519,000
--
Bed
3
Baths
2,006
Sq Ft
$245/Sq Ft
Est. Value
About This Home
This home is located at 9613 Westerdale Dr, Upper Marlboro, MD 20774 and is currently estimated at $490,540, approximately $244 per square foot. 9613 Westerdale Dr is a home located in Prince George's County with nearby schools including Arrowhead Elementary School, Kettering Middle School, and Largo High School.
Ownership History
Date
Name
Owned For
Owner Type
Purchase Details
Closed on
Sep 1, 2021
Sold by
Muldrow Deborah and Evans Deborah B
Bought by
Evans Deborah B
Current Estimated Value
Home Financials for this Owner
Home Financials are based on the most recent Mortgage that was taken out on this home.
Original Mortgage
$358,160
Outstanding Balance
$326,740
Interest Rate
3.12%
Mortgage Type
New Conventional
Estimated Equity
$163,800
Purchase Details
Closed on
May 30, 2014
Sold by
Dan Ryan Builders Mid Atlantic Inc
Bought by
Muldrow Deborah
Home Financials for this Owner
Home Financials are based on the most recent Mortgage that was taken out on this home.
Original Mortgage
$348,647
Interest Rate
4.25%
Mortgage Type
FHA
Purchase Details
Closed on
Sep 9, 2013
Sold by
Westphalia Row Partners Llc
Bought by
Dan Ryan Builders Mid Atlantic Inc
Create a Home Valuation Report for This Property
The Home Valuation Report is an in-depth analysis detailing your home's value as well as a comparison with similar homes in the area
Home Values in the Area
Average Home Value in this Area
Purchase History
| Date | Buyer | Sale Price | Title Company |
|---|---|---|---|
| Evans Deborah B | -- | Eagle Title Agency Llc | |
| Muldrow Deborah | $355,079 | Keystone Title Settlement Se | |
| Dan Ryan Builders Mid Atlantic Inc | $320,000 | Keystone Title Settlement Se |
Source: Public Records
Mortgage History
| Date | Status | Borrower | Loan Amount |
|---|---|---|---|
| Open | Evans Deborah B | $358,160 | |
| Closed | Muldrow Deborah | $348,647 |
Source: Public Records
Tax History Compared to Growth
Tax History
| Year | Tax Paid | Tax Assessment Tax Assessment Total Assessment is a certain percentage of the fair market value that is determined by local assessors to be the total taxable value of land and additions on the property. | Land | Improvement |
|---|---|---|---|---|
| 2025 | $6,994 | $456,600 | $125,000 | $331,600 |
| 2024 | $6,994 | $445,233 | $0 | $0 |
| 2023 | $6,824 | $433,867 | $0 | $0 |
| 2022 | $6,655 | $422,500 | $100,000 | $322,500 |
| 2021 | $6,527 | $413,867 | $0 | $0 |
| 2020 | $6,399 | $405,233 | $0 | $0 |
| 2019 | $5,679 | $396,600 | $100,000 | $296,600 |
| 2018 | $5,579 | $365,600 | $0 | $0 |
| 2017 | $4,888 | $334,600 | $0 | $0 |
| 2016 | -- | $303,600 | $0 | $0 |
| 2015 | -- | $299,533 | $0 | $0 |
| 2014 | -- | $15,000 | $0 | $0 |
Source: Public Records
Map
Nearby Homes
- 9521 Westerdale Dr
- 1631 Wesbourne Dr
- 9531 Chestnut Park St
- 9513 Weshurst Ln
- 9402 Beech Park St
- 2000 Grovewood Dr
- 9400 Dogwood Park St
- 0001 Good Faith Way
- Cape May Plan at The Venue
- 2005 Elmwood Park Dr
- 9611 Good Faith Way
- 1615 Morning Star Ct
- 9606 Spiritual Ln
- 9607 Good Faith Way
- 1619 Morning Star Ct
- 9617 Good Faith Way
- 9602 Spiritual Ln
- 9624 Spiritual Ln
- 1621 Morning Star Ct
- 9605 Good Faith Way
- 9617 Westerdale Dr
- 9611 Westerdale Dr
- 9619 Westerdale Dr
- 9609 Westerdale Dr
- 9600 Westerdale Dr
- 9621 Westerdale Dr
- 9623 Westerdale Dr
- 9607 Westerdale Dr
- 9602 Westerdale Dr
- 1710 Walcott Ln
- 9605 Westerdale Dr
- 1712 Walcott Ln
- 9625 Westerdale Dr
- 9603 Westerdale Dr
- 1714 Walcott Ln
- 1715 Sansbury Rd
- 9604 Westerdale Dr
- 9626 Westerdale Dr
- 9624 Westerdale Dr