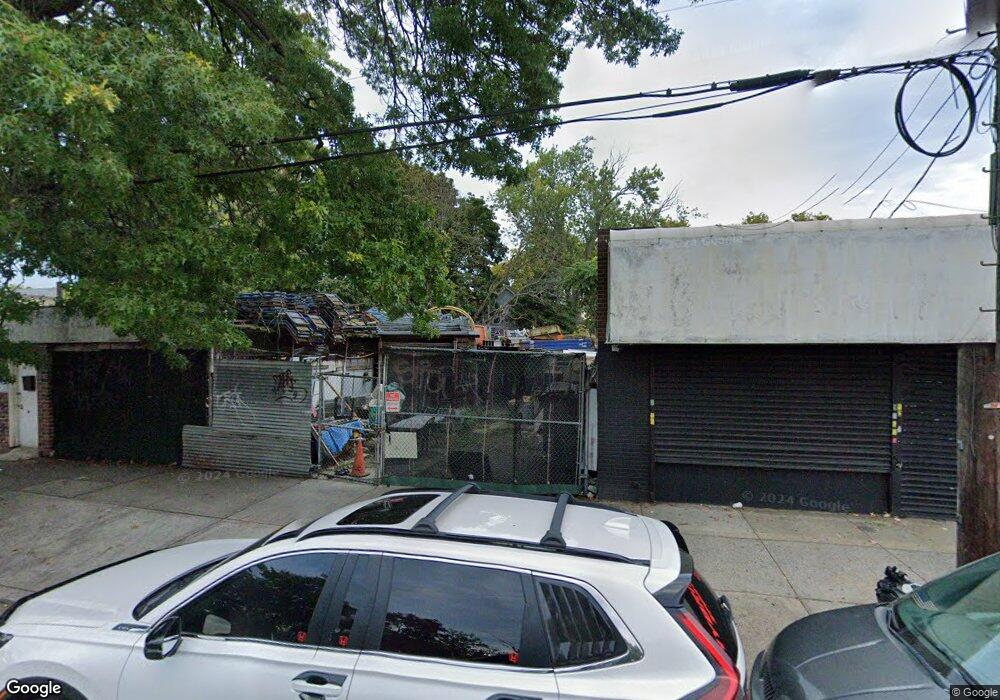
9619 Atlantic Ave Jamaica, NY 11421
Woodhaven NeighborhoodEstimated Value: $218,967
--
Bed
--
Bath
1,800
Sq Ft
$122/Sq Ft
Est. Value
About This Home
This home is located at 9619 Atlantic Ave, Jamaica, NY 11421 and is currently estimated at $218,967, approximately $121 per square foot. 9619 Atlantic Ave is a home located in Queens County with nearby schools including P.S. 273, Jhs 210 Elizabeth Blackwell, and Richmond Hill High School.
Ownership History
Date
Name
Owned For
Owner Type
Purchase Details
Closed on
Dec 3, 2003
Sold by
Amrenco Inc
Bought by
Soni Builders Group Inc
Current Estimated Value
Purchase Details
Closed on
Oct 15, 2002
Sold by
Cooper-Gregory Helen A and Walsh John T
Bought by
Amrenco Inc
Home Financials for this Owner
Home Financials are based on the most recent Mortgage that was taken out on this home.
Original Mortgage
$85,000
Interest Rate
6.09%
Mortgage Type
Commercial
Create a Home Valuation Report for This Property
The Home Valuation Report is an in-depth analysis detailing your home's value as well as a comparison with similar homes in the area
Home Values in the Area
Average Home Value in this Area
Purchase History
| Date | Buyer | Sale Price | Title Company |
|---|---|---|---|
| Soni Builders Group Inc | $115,000 | -- | |
| Amrenco Inc | -- | -- |
Source: Public Records
Mortgage History
| Date | Status | Borrower | Loan Amount |
|---|---|---|---|
| Previous Owner | Amrenco Inc | $85,000 |
Source: Public Records
Tax History Compared to Growth
Tax History
| Year | Tax Paid | Tax Assessment Tax Assessment Total Assessment is a certain percentage of the fair market value that is determined by local assessors to be the total taxable value of land and additions on the property. | Land | Improvement |
|---|---|---|---|---|
| 2025 | $5,844 | $53,100 | $54,360 | -- |
| 2024 | $5,844 | $55,170 | $55,170 | -- |
| 2023 | $5,969 | $56,070 | $56,070 | $0 |
| 2022 | $5,566 | $51,750 | $51,750 | $0 |
| 2021 | $5,505 | $54,450 | $54,450 | $0 |
| 2020 | $4,960 | $57,150 | $57,150 | $0 |
| 2019 | $4,400 | $60,300 | $60,300 | $0 |
| 2018 | $3,728 | $35,460 | $35,460 | $0 |
| 2017 | $3,145 | $29,917 | $29,917 | $0 |
| 2016 | $2,916 | $29,917 | $29,917 | $0 |
| 2015 | $1,713 | $26,946 | $26,946 | $0 |
| 2014 | $1,713 | $26,587 | $26,587 | $0 |
Source: Public Records
Map
Nearby Homes