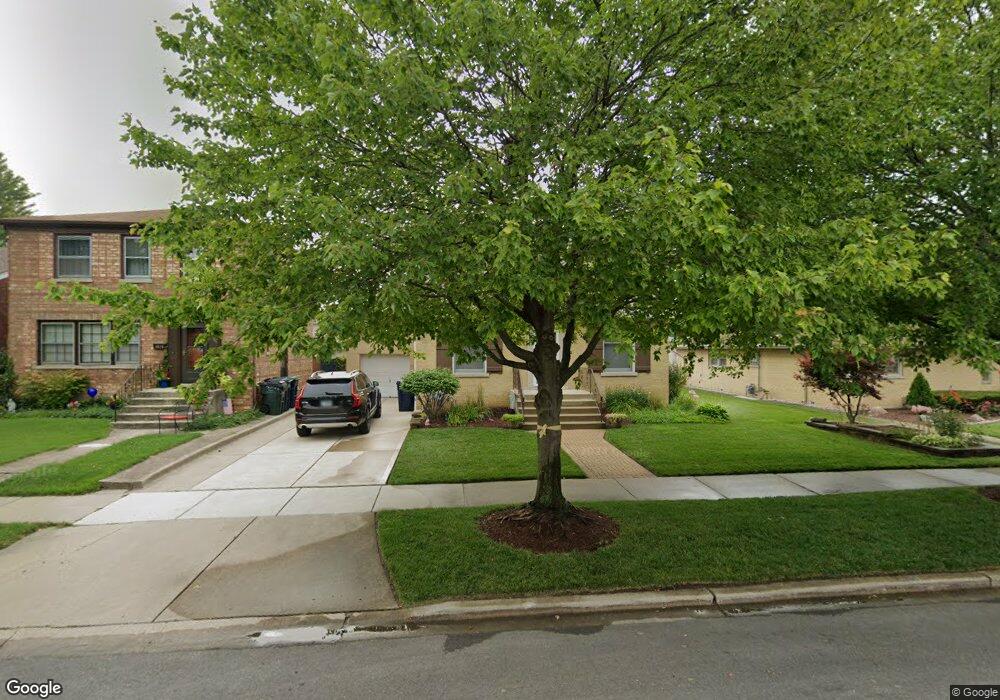
9623 S Ridgeway Ave Evergreen Park, IL 60805
Estimated Value: $385,365 - $526,000
--
Bed
2
Baths
2,340
Sq Ft
$200/Sq Ft
Est. Value
About This Home
This home is located at 9623 S Ridgeway Ave, Evergreen Park, IL 60805 and is currently estimated at $466,841, approximately $199 per square foot. 9623 S Ridgeway Ave is a home located in Cook County with nearby schools including Southwest Elementary School, Central Jr High School, and Evergreen Park High School.
Ownership History
Date
Name
Owned For
Owner Type
Purchase Details
Closed on
Apr 15, 2022
Sold by
Bernick Elizabeth C and Elizabeth C Bernick Revocable Trust
Bought by
Harrigan Mike and Harrigan Kelly
Current Estimated Value
Home Financials for this Owner
Home Financials are based on the most recent Mortgage that was taken out on this home.
Original Mortgage
$399,600
Interest Rate
3.99%
Purchase Details
Closed on
Feb 28, 2022
Sold by
Bernick Elizabeth C and Elizabeth C Bernick Revocable Trust
Bought by
Harrigan Mike and Harrigan Kelly
Home Financials for this Owner
Home Financials are based on the most recent Mortgage that was taken out on this home.
Original Mortgage
$399,600
Interest Rate
3.99%
Purchase Details
Closed on
Sep 13, 2011
Sold by
Huber John and Huber Susan
Bought by
Elizabeth C Bernick Revocable Trust and Daniel J Huber/Bernick Trust
Create a Home Valuation Report for This Property
The Home Valuation Report is an in-depth analysis detailing your home's value as well as a comparison with similar homes in the area
Home Values in the Area
Average Home Value in this Area
Purchase History
| Date | Buyer | Sale Price | Title Company |
|---|---|---|---|
| Harrigan Mike | $448,000 | -- | |
| Harrigan Mike | $448,000 | -- | |
| Elizabeth C Bernick Revocable Trust | $275,000 | Chicago Title Insurance Co |
Source: Public Records
Mortgage History
| Date | Status | Borrower | Loan Amount |
|---|---|---|---|
| Previous Owner | Harrigan Mike | $399,600 |
Source: Public Records
Tax History Compared to Growth
Tax History
| Year | Tax Paid | Tax Assessment Tax Assessment Total Assessment is a certain percentage of the fair market value that is determined by local assessors to be the total taxable value of land and additions on the property. | Land | Improvement |
|---|---|---|---|---|
| 2024 | $6,314 | $18,500 | $2,604 | $15,896 |
| 2023 | $4,237 | $18,500 | $2,604 | $15,896 |
| 2022 | $4,237 | $12,416 | $2,232 | $10,184 |
| 2021 | $4,110 | $12,416 | $2,232 | $10,184 |
| 2020 | $3,999 | $12,416 | $2,232 | $10,184 |
| 2019 | $3,941 | $11,862 | $2,046 | $9,816 |
| 2018 | $3,861 | $11,862 | $2,046 | $9,816 |
| 2017 | $3,808 | $11,862 | $2,046 | $9,816 |
| 2016 | $3,600 | $10,343 | $1,674 | $8,669 |
| 2015 | $3,583 | $10,343 | $1,674 | $8,669 |
| 2014 | $3,507 | $10,343 | $1,674 | $8,669 |
| 2013 | $4,137 | $12,897 | $1,674 | $11,223 |
Source: Public Records
Map
Nearby Homes
- 9701 S Springfield Ave
- 9451 S Lawndale Ave
- 9858 S Millard Ave
- 3900 W 95th St Unit 303
- 9338 S Ridgeway Ave
- 9609 S Komensky Ave Unit 204
- 9319 S Ridgeway Ave
- 9427 S Saint Louis Ave
- 9835 S Saint Louis Ave
- 9740 S Pulaski Rd Unit 9740306
- 9740 S Pulaski Rd Unit 107
- 9620 S Komensky Ave Unit 305
- 9321 S Avers Ave
- 9720 S Pulaski Rd Unit 306
- 9720 S Pulaski Rd Unit 502
- 9720 S Pulaski Rd Unit 602
- 9314 S Central Park Ave
- 9725 S Karlov Ave Unit 610
- 9725 S Karlov Ave Unit 501
- 9725 S Karlov Ave Unit 401
- 9629 S Ridgeway Ave
- 9629 S Ridgeway Ave
- 9623 S Ridgeway Ave
- 9637 S Ridgeway Ave
- 9619 S Ridgeway Ave
- 9615 S Ridgeway Ave
- 9615 S Ridgeway Ave
- 9641 S Ridgeway Ave
- 9641 S Ridgeway Ave
- 9622 S Lawndale Ave
- 9622 S Lawndale Ave
- 9618 S Lawndale Ave
- 9616 S Lawndale Ave
- 9626 S Lawndale Ave
- 9626 S Lawndale Ave
- 9626 S Ridgeway Ave
- 9626 S Ridgeway Ave
- 9630 S Ridgeway Ave
- 9645 S Ridgeway Ave
- 9610 S Lawndale Ave